|

USD/JPY Price Analysis: Grinds higher around mid-140.00s within rising channel despite overbought RSI

  • USD/JPY recovers from intraday low within three-week-old bullish chart formation.
  • Monday’s bearish candlestick formation, overbought RSI (14) line lure bears.
  • Clear downside break of 140.00 needed to lure the Yen buyers.
  • Bulls need 141.00 breakout to aim for late November peak.

USD/JPY makes rounds to 140.50 as bulls and bears jostle amid mixed technical signals heading into Tuesday’s European session.

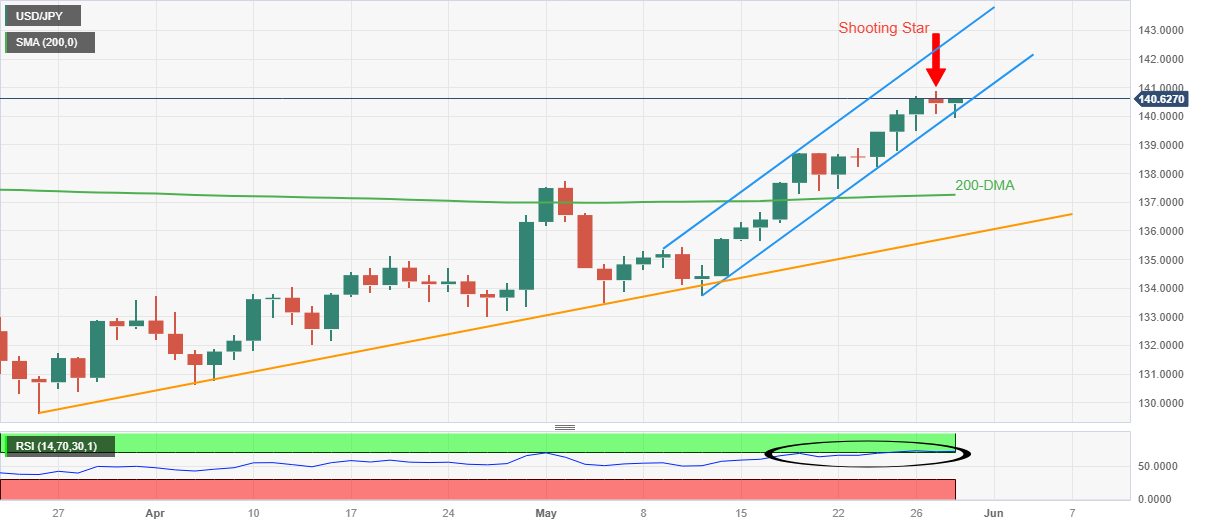
That said, the Yen pair portrays a three-week-old bullish channel, currently between 140.20 and 141.85, to keep the buyers hopeful.

However, the overbought conditions of the RSI (14) line join Monday’s “Shooting Star” candlestick to suggest that the bulls are running out of steam.

As a result, the USD/JPY traders should remain cautious before taking any fresh positions, especially on the short side considering the US Dollar’s broad strength, unless the quote remains within the stated channel.

Even if the quote breaks the 140.20 support, the 140.00 psychological magnet will act as an extra filter toward the south before directing the bears toward the 200-SMA level of 137.25.

Following that, an upward-sloping support line from March 24, close to 135.80 at the latest, will be the key to defending the buyers.

On the flip side, the USD/JPY pair’s successful trading above the previous day’s peak of 140.92 defies the bearish candlestick. However, the buyers will need to cross the 141.00 round figure for conviction.

In that case, the late November 2022 peak of 142.25 may act as an intermediate halt ahead of directing the bulls to the stated channel’s top line of around 142.85.

USD/JPY: Daily chart

Trend: Further upside expected

Additional important levels

Overview
Today last price140.48
Today Daily Change0.02
Today Daily Change %0.01%
Today daily open140.46
 
Trends
Daily SMA20136.99
Daily SMA50134.67
Daily SMA100133.6
Daily SMA200137.24
 
Levels
Previous Daily High140.92
Previous Daily Low140.11
Previous Weekly High140.72
Previous Weekly Low137.49
Previous Monthly High136.56
Previous Monthly Low130.63
Daily Fibonacci 38.2%140.42
Daily Fibonacci 61.8%140.61
Daily Pivot Point S1140.08
Daily Pivot Point S2139.69
Daily Pivot Point S3139.27
Daily Pivot Point R1140.88
Daily Pivot Point R2141.3
Daily Pivot Point R3141.69

Author

Anil Panchal

Anil Panchal

FXStreet

Anil Panchal has nearly 15 years of experience in tracking financial markets. With a keen interest in macroeconomics, Anil aptly tracks global news/updates and stays well-informed about the global financial moves and their implications.

More from Anil Panchal
Share:

Markets move fast. We move first.

Orange Juice Newsletter brings you expert driven insights - not headlines. Every day on your inbox.

By subscribing you agree to our Terms and conditions.

Editor's Picks

EUR/USD moves sideways below 1.1800 on Christmas Eve

EUR/USD struggles to find direction and trades in a narrow channel below 1.1800 after posting gains for two consecutive days. Bond and stock markets in the US will open at the usual time and close early on Christmas Eve, allowing the trading action to remain subdued. 

GBP/USD keeps range around 1.3500 amid quiet markets

GBP/USD keeps its range trade intact at around 1.3500 on Wednesday. The Pound Sterling holds the upper hand over the US Dollar amid pre-Christmas light trading as traders move to the sidelines heading into the holiday season. 

Gold retreats from record highs, trades below $4,500

Gold retreats after setting a new record-high above $4,520 earlier in the day and trades in a tight range below $4,500 as trading volumes thin out ahead of the Christmas break. The US Dollar selling bias remains unabated on the back of dovish Fed expectations, which continues to act as a tailwind for the bullion amid persistent geopolitical risks.

Bitcoin slips below $87,000 as ETF outflows intensify, whale participation declines

Bitcoin price continues to trade around $86,770 on Wednesday, after failing to break above the $90,000 resistance. US-listed spot ETFs record an outflow of $188.64 million on Tuesday, marking the fourth consecutive day of withdrawals.

Economic outlook 2026-2027 in advanced countries: Solidity test

After a year marked by global economic resilience and ending on a note of optimism, 2026 looks promising and could be a year of solid economic performance. In our baseline scenario, we expect most of the supportive factors at work in 2025 to continue to play a role in 2026.

Avalanche struggles near $12 as Grayscale files updated form for ETF

Avalanche trades close to $12 by press time on Wednesday, extending the nearly 2% drop from the previous day. Grayscale filed an updated form to convert its Avalanche-focused Trust into an ETF with the US Securities and Exchange Commission.