USD/JPY Price Analysis: spikes to mid-136s after ISM Non-Manufacturing data but then retreats
- USD/JPY turns around from daily lows and rises briefly after US Non-Manufacturing PMI beat.
- ISM data comes out at 55.1 vs. 54.5 expected and just below previous month.
- The still-hawkish Fed compared to perma-dovish BoJ helps support the major higher.

The USD/JPY pair stops and reverses the early selling bias on Friday and spikes higher after the release of US data from ISM compiled from surveys of purchasing managers in the services sector beat expectations. The results suggested the American economy is still in fine form and the Fed will need to continue tightening policy aggressively in its wrestle with the beast of inflation. Nevertheless, gains proved temporary as the pair gradually fell back down to the lower 136s after the initial furious rally higher.
The ISM Non-Manufactruing PMI data for February, showed a rise to 55.1, roundly beating expectations of 54.5, and almost pipping the previous month's 55.2. US Dollar pairs reacted immediately, and began rising as traders bet on the Federal Reserve having to step in with sterner disinflationary measures, perhaps even raising interest rates more aggressively than is currently expected, with probabilities steadily rising of the higher 50 bps rate hike coming from the Fed in March.
The data also showed a rise in the Employment component of the survey, to 54.0 from 50.0 and New Orders to 62.6 from 60.4. Price Paid fell to 65.6 from 67.8, however, offsetting the hype marginally and suggesting a slight easing in inflationary forces. The Business Activity component, meanwhile showed a fall 56.3 from 60.4.
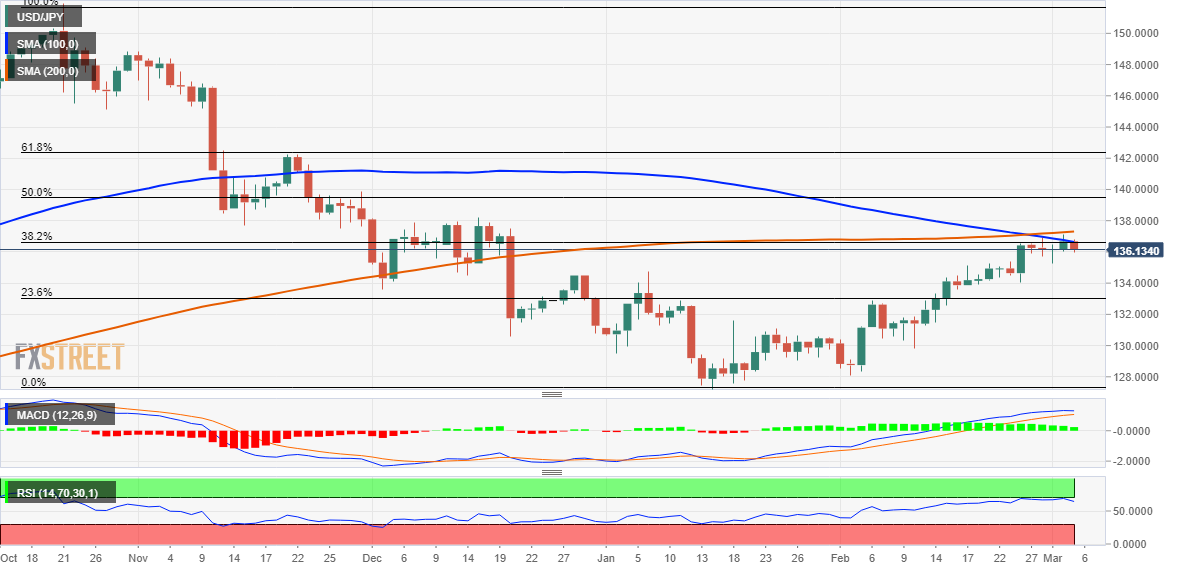
From a technical perspective, the USD/JPY pair is in a short-to-medium term uptrend which is expected to extend given a lack of reversal signs so far. Yet lately it has struggled to break above the 100 and 200-day Simple Moving Averages (SMA) between 136.50 and 137.00 and these appear to be successfully baring further growth.
If bulls can successfully break above them, however, it will also confirm a breakout through the 38.2% Fibonacci retracement level of the recent pullback from over a three-decade high and pave the way for additional gains. The USD/JPY pair might then accelerate the move to reclaim the 138.00 mark en route to the 138.75 zone, the 139.00 round figure and the 139.60 region (50% Fibo. level).
On the flip side, sustained weakness below the 136.00 level might prompt some technical selling and drag the USD/JPY pair to the weekly low, around the 135.25 region. It would require a break below the key 134.05 February 24 low – the last key higher low of the previous uptrend – to reverse the sequence of rising peaks and troughs and define the beginning of a new downtrend.
A key event for the USD/JPY pair will be the Bank of Japan (BoJ) policy meeting next week. That said, a convincing break below the 134.05 low could make spot prices vulnerable to sliding further towards the 23.6% Fibo. level support, just ahead of the 133.00 mark.
USD/JPY daily chart
Key levels to watch
Author

Haresh Menghani
FXStreet
Haresh Menghani is a detail-oriented professional with 10+ years of extensive experience in analysing the global financial markets.


