|

USD/JPY Price Analysis: Firm above 138.00 on Fed hawkish comments, boosting the US Dollar

  • USD/JPY pair underpinned by high US T-bond yields, strong US Dollar.
  • Despite last week’s negative outcome, the USD/JPY clings to gains above a five-month-old support trendline.
  • Upside risks lie at 138.74, followed by 139.00; support is seen at 137.20s, 137.00.

USD/JPY resumes its uptrend, creeping higher above the 138.00 figure as the US Dollar (USD) strengthens, underpinned by higher US Treasury bond yields. Hawkish comments by Federal Reserve (Fed) officials, and positive discussions on the US debt ceiling, keeps the USD/JPY pair trading higher. Hence, the USD/JPY is trading at 138.51, a gain of 0.43%.

USD/JPY Price Analysis: Technical outlook

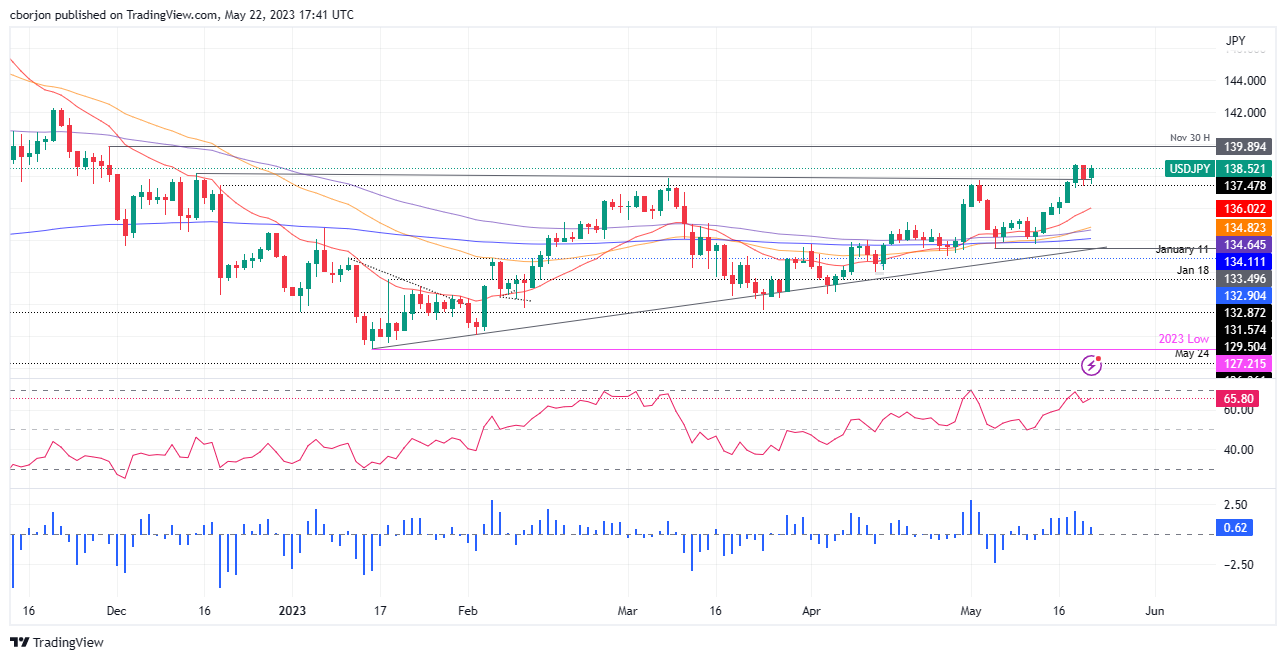
After finishing the last week with a negative session, the USD/JPY is still trading above a five-month-old resistance trendline, which turned support on May 18, which opened the door to a new year-to-date (YTD) high of 138.74, before a pullback to 137.25. The USD/JPYs bounced off that level and reclaimed the 138.00 figure.

Of note, the USD/JPY reached a new higher-high, while the Relative Strength Index (RSI) did not, peaking around 69.00 before entering overbought conditions, retraced towards the 65.00 area, suggesting buyers are losing momentum. The 3-day Rate of Change (RoC) it’s declining as buyers lose steam.

If USD/JPY breaks above the YTD high at 138.74, the next resistance would be the 139.00 figure, a zone that could propel the pair towards the 140.00 area, but buyers must crack the November 30 daily high of 139.89.

On the other hand, the USD/JPY first support would be 138.00. Break below will expose the May 18 low of 137.28 before challenging the 137.00 mark.

USD/JPY Price Action – Daily chart

USD/JPY Daily chart

USD/JPY

Overview
Today last price138.5
Today Daily Change0.53
Today Daily Change %0.38
Today daily open137.97
 
Trends
Daily SMA20135.57
Daily SMA50133.87
Daily SMA100133.14
Daily SMA200137.12
 
Levels
Previous Daily High138.73
Previous Daily Low137.43
Previous Weekly High138.75
Previous Weekly Low135.65
Previous Monthly High136.56
Previous Monthly Low130.63
Daily Fibonacci 38.2%137.93
Daily Fibonacci 61.8%138.23
Daily Pivot Point S1137.35
Daily Pivot Point S2136.74
Daily Pivot Point S3136.05
Daily Pivot Point R1138.66
Daily Pivot Point R2139.35
Daily Pivot Point R3139.96

Author

Christian Borjon Valencia

Christian Borjon began his career as a retail trader in 2010, mainly focused on technical analysis and strategies around it. He started as a swing trader, as he used to work in another industry unrelated to the financial markets.

More from Christian Borjon Valencia
Share:

Markets move fast. We move first.

Orange Juice Newsletter brings you expert driven insights - not headlines. Every day on your inbox.

By subscribing you agree to our Terms and conditions.

Editor's Picks

EUR/USD moves sideways below 1.1800 on Christmas Eve

EUR/USD struggles to find direction and trades in a narrow channel below 1.1800 after posting gains for two consecutive days. Bond and stock markets in the US will open at the usual time and close early on Christmas Eve, allowing the trading action to remain subdued. 

GBP/USD keeps range around 1.3500 amid quiet markets

GBP/USD keeps its range trade intact at around 1.3500 on Wednesday. The Pound Sterling holds the upper hand over the US Dollar amid pre-Christmas light trading as traders move to the sidelines heading into the holiday season. 

Gold retreats from record highs, trades below $4,500

Gold retreats after setting a new record-high above $4,520 earlier in the day and trades in a tight range below $4,500 as trading volumes thin out ahead of the Christmas break. The US Dollar selling bias remains unabated on the back of dovish Fed expectations, which continues to act as a tailwind for the bullion amid persistent geopolitical risks.

Bitcoin slips below $87,000 as ETF outflows intensify, whale participation declines

Bitcoin price continues to trade around $86,770 on Wednesday, after failing to break above the $90,000 resistance. US-listed spot ETFs record an outflow of $188.64 million on Tuesday, marking the fourth consecutive day of withdrawals.

Economic outlook 2026-2027 in advanced countries: Solidity test

After a year marked by global economic resilience and ending on a note of optimism, 2026 looks promising and could be a year of solid economic performance. In our baseline scenario, we expect most of the supportive factors at work in 2025 to continue to play a role in 2026.

Avalanche struggles near $12 as Grayscale files updated form for ETF

Avalanche trades close to $12 by press time on Wednesday, extending the nearly 2% drop from the previous day. Grayscale filed an updated form to convert its Avalanche-focused Trust into an ETF with the US Securities and Exchange Commission.