|

USD/JPY Price Analysis: Establishment above 200-EMA at around 134.50 supports bulls

  • A consolidation above the 200-EMA adds to the upside filters.
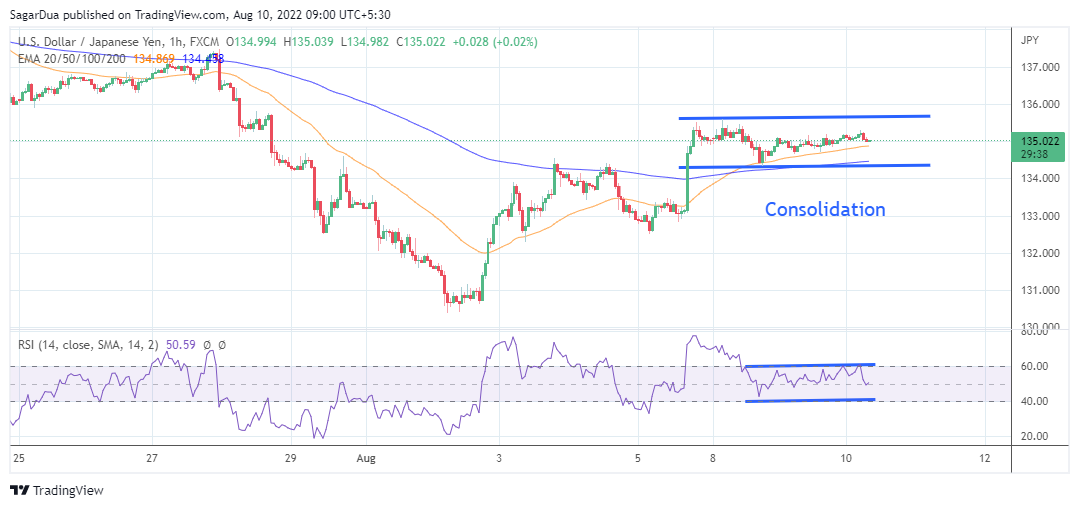
  • The RSI (14) is oscillating in a 40.00-60.00 range and awaits a potential trigger.
  • For more upside, the greenback bulls need to break above the 134.34-135.58 range decisively.

The USD/JPY pair has witnessed mild selling pressure after printing an intraday high of 135.24 in the Asian session. The asset is walking northwards briskly to recapture its two-week high at 135.58. However, a slower upside move signals exhaustion and could trigger downside momentum at any time.

Movement in a marked territory for the past three trading sessions is indicating the unavailability of a potential trigger for a decisive move. The asset is oscillating in a 134.34-135.58 range and is likely to remain lackluster till the announcement of the US Consumer Price Index (CPI) data.

The asset is comfortably established above the 200-period Exponential Moving Average (EMA) at 135.58, which adds to the upside filters. Also, the 50-EMA at 134.90 is advancing higher, which warrants a bullish short-term scenario.

Meanwhile, the Relative Strength Index (RSI) (14) is oscillating in the 40.00-60.00 range and advocates a wait and watch approach.

A decisive break above Monday’s high at 135.58 will drive the asset towards July 26 high at 136.27, followed by the round-level resistance at 137.00.

On the contrary, the yen bulls could regain control if the asset drops below Friday’s low at 132.52. An occurrence of the same will drag the asset towards the August 1 low at 131.60 and the August 2 low at 130.39.

USD/JPY hourly chart

USD/JPY

Overview
Today last price135.01
Today Daily Change-0.01
Today Daily Change %-0.01
Today daily open135.02
 
Trends
Daily SMA20135.86
Daily SMA50135.15
Daily SMA100131.01
Daily SMA200122.97
 
Levels
Previous Daily High135.2
Previous Daily Low134.67
Previous Weekly High135.5
Previous Weekly Low130.4
Previous Monthly High139.39
Previous Monthly Low132.5
Daily Fibonacci 38.2%135
Daily Fibonacci 61.8%134.87
Daily Pivot Point S1134.72
Daily Pivot Point S2134.43
Daily Pivot Point S3134.19
Daily Pivot Point R1135.26
Daily Pivot Point R2135.5
Daily Pivot Point R3135.79

Author

Sagar Dua

Sagar Dua

FXStreet

Sagar Dua is associated with the financial markets from his college days. Along with pursuing post-graduation in Commerce in 2014, he started his markets training with chart analysis.

More from Sagar Dua
Share:

Editor's Picks

EUR/USD shifts its attention to 1.1900 and above

EUR/USD has shaken off Tuesday’s dip, pushing back beyond the 1.1800 mark amid decent gains as  Wednesday’s session draws to a close. The rebound is largely driven by a modest pullback in the US Dollar, as markets digest the aftermath of President Trump’s SOTU speech and continue to monitor trade-related headlines and signals from the White House.
 

GBP/USD challenges multi-day highs near 1.3530

GBP/USD leaves behind the previous day’s decline and regains fresh upside traction on Wednesday, surpassing the 1.3500 barrier in a context of a modest decline in the Greenback and a generalised improved mood in the risk-linked space. Meanwhile, the US tariff narrative continues to dictate the mood among market participants after Presidet Trump’s SOTU speech failed to surprise markets.

Gold remains bid and close to $5,200

Gold buyers are returning to the fold on Wednesday, targeting the $5,200 area and possibly beyond, after Tuesday’s corrective dip from monthly highs. The rebound in the precious metal comes as the US Dollar loses traction, with Trump’s SOTU speech offering little fresh direction and AI-related nerves continuing to ease.

UK financial watchdog advances stablecoin oversight as four firms pilot issuance

The Financial Conduct Authority (FCA) in the United Kingdom (UK) is advancing toward the final stablecoin regulatory framework with a pilot program involving four companies, including Monee, Financial Technologies ReStabilise, Revolut and VVTX.

Nvidia earnings to influence AI trade and broader market sentiment

For the last three years, Nvidia has been the engine of the AI boom, and now Wall Street is watching to see whether that momentum can keep going. High-growth stocks have been struggling to maintain their bullish trend in 2026.

Cosmos Hub Price Forecast: ATOM rebounds slightly, bearish outlook remains intact

Cosmos Hub (ATOM) price rebounds, trading above $2.05 at the time of writing on Wednesday, after undergoing a sharp correction since last week. Weakening on-chain and derivatives data support a bearish outlook, while technical analysis remains unfavorable.