|

USD/JPY Price Analysis: Drops from around 24-year highs, back below 137.00

  • The Japanese yen strengthened on verbal intervention by the Japanese Finance Minister Suzuki.
  • On Tuesday, the USD/JPY tumbled towards a daily low of around 136.50 before settling near the June 21 highs.
  • USD/JPY Price Analysis: The major remains upward biased, but a rising wedge has formed, which targets a fall towards 129.50.

The USD/JPY retreats from 24-year highs around 137.75, falling more than 100-pips during the North American session, due to falling US bond yields and talks between the US Treasury Secretary Janet Yellen and Japan’s Finance Minister Suzuki, in which he told her about the weakening of the yen and agreed to continue consulting in foreign exchange.

At the time of writing, the USD/JPY is trading at 136.73, down by more than half percent, after reaching a daily high of around 137.53, to stumble towards fresh daily lows below 136.50 before settling around current price levels.
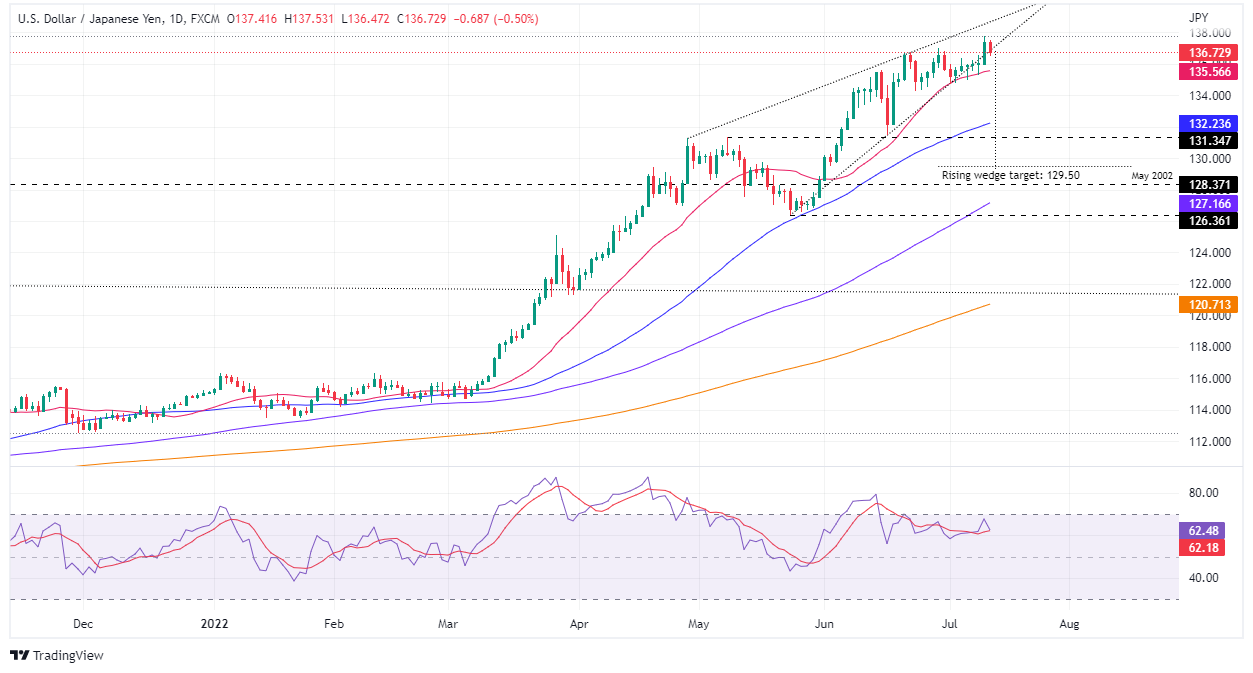
USD/JPY Daily chart

The USD/JPY daily chart illustrates the pair as upward biased, though forming a rising wedge, meaning selling pressure might be around the corner, to step in on the pair and drag it lower. Also, with the Relative Strength Index (RSI) stepping out of overbought conditions and about to cross under the RSI’s 7-day SMA, that would open the door for further downside.

 If the USD/JPY break below the rising wedge, its first support would be the 20-day EMA at 135.56. Once cleared, the next demand zone to test would be the July 1 low at 134.74, followed by the 50-day EMA at 132.23, on its way, towards the measured target, using the top-bottom trendlines that form the rising wedge at around 129.50.

USD/JPY Key Technical Levels

USD/JPY

Overview
Today last price136.73
Today Daily Change-0.70
Today Daily Change %-0.51
Today daily open137.43
 
Trends
Daily SMA20135.53
Daily SMA50132.14
Daily SMA100126.97
Daily SMA200120.61
 
Levels
Previous Daily High137.75
Previous Daily Low135.99
Previous Weekly High136.56
Previous Weekly Low134.78
Previous Monthly High137
Previous Monthly Low128.65
Daily Fibonacci 38.2%137.08
Daily Fibonacci 61.8%136.66
Daily Pivot Point S1136.36
Daily Pivot Point S2135.29
Daily Pivot Point S3134.59
Daily Pivot Point R1138.13
Daily Pivot Point R2138.83
Daily Pivot Point R3139.9

Author

Christian Borjon Valencia

Markets analyst, news editor, and trading instructor with over 14 years of experience across FX, commodities, US equity indices, and global macro markets.

More from Christian Borjon Valencia
Share:

Editor's Picks

AUD/USD falls to near 0.7100 after slipping below 50-day EMA

AUD/USD depreciates after registering minor gains in the previous day, trading around 0.7120 during the Asian hours. The technical analysis of the daily chart shows the pair consolidating sideways within a rectangle pattern, as neither bulls nor bears gain control. The AUD/USD pair is holding a slight bearish tone however as it sits beneath both the nine-day and 50-day EMAs.

160.00: USD/JPY back near intervention territory after upbeat US jobs report

US Nonfarm Payrolls beat expectations by a wide margin in May, with 172K jobs added. The US Dollar rebounds after the release, helping USD/JPY recover from its intraday lows. Warnings from Japanese authorities continue to limit upside potential near the 160.00 threshold.

Gold targets $4,300 amid stronger Dollar

Gold faces increasing selling interest and navigates the area of three-month lows near the $4,300 mark per troy ounce on Friday. The precious metal’s decline comes as traders assess the stronger-than-expected NFP, while the bid bias in the Greenback and higher US Treasury yields also collaborate with the retracement.

Cardano hits five-year low even as Hoskinson clarifies "break" isn't an exit

Cardano (ADA) price is down 10% at press time on Friday, extending losses over 30% so far this week amid Charles Hoskinson's clarification that "break" isn't an exit.

Week ahead – Fed countdown begins amid US inflation data and geopolitical risks

Fed Chair Warsh’s first meeting approaches as key US inflation data could reshape expectations. Oil prices remain elevated as US-Iran talks continue; tariffs also return to the spotlight. ECB is expected to hike; will it be a one-off move or is July live?

The US economy defies the rules: 100 days into the Oil shock and the recession signal is still missing

More than three months after the start of the Iran war and the resulting disruption to global energy markets, the US economy continues to display remarkable resilience. The conflict has triggered a sharp rise in Oil prices, reignited inflationary pressures and fueled widespread concerns about a potential economic slowdown.