USD/JPY Price Analysis: Consolidates around 157.50 ahead of the weekend
- USD/JPY rises up 0.06%, but fails to break above 158.00.
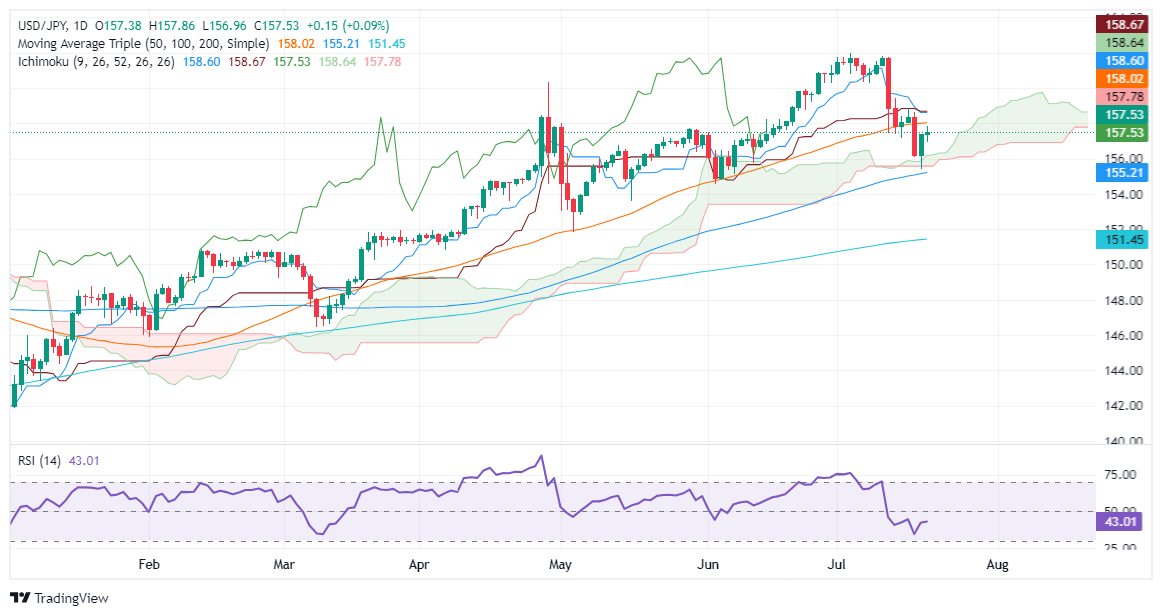
- Bearish signals: RSI turning bearish, Chikou Span crossing below price action, and Tenkan-Sen crossing beneath Kijun-Sen.
- Key supports at 157.00, 156.00, and bottom of the Kumo at 155.50/60; further support at 155.37 and 155.00.
- Potential resistance at 157.50 and July 16 peak at 158.85 if buyers push the pair higher.

The USD/JPY edged up during the North American session, gaining a decent 0.06% as traders failed to push the exchange rate above 158.00. At the time of writing, the major consolidates in the middle of a 90-pip range and trades at 157.44.
USD/JPY Price Analysis: Technical outlook
The USD/JPY trades subdued ahead of the weekend, but momentum remains on the sellers’ side. The Relative Strength Index (RSI) turning bearish and the Chikou Span crossing below price action, were the first two signals of further weakness. This and the Tenkan-Sen crossing beneath the Kijun-Sen could push prices below the Ichimoku Cloud (Kumo).
If USD/JPY drops below 157.00, that will exert downward pressure on the pair and push prices toward 156.00, ahead of piercing the bottom of the Kumo at 155.50/60. Once those two levels are surpassed, the next demand zone would be the July 18 low of 155.37 ahead of 155.00. A further downside is below that level, exposing the May 16 swing low of 153.61, followed by the May 2 pivot low at 151.87, ahead of testing the 151.00 mark.
Conversely, if buyers stepped in and pushed the USD/JPY above 157.50, look for a re-test of the July 16 peak at 158.85.
USD/JPY Price Action – Daily Chart
Japanese Yen PRICE Today
The table below shows the percentage change of Japanese Yen (JPY) against listed major currencies today. Japanese Yen was the strongest against the New Zealand Dollar.
| USD | EUR | GBP | JPY | CAD | AUD | NZD | CHF | |
|---|---|---|---|---|---|---|---|---|
| USD | 0.15% | 0.26% | 0.09% | 0.18% | 0.34% | 0.61% | 0.15% | |
| EUR | -0.15% | 0.11% | -0.05% | 0.00% | 0.18% | 0.46% | 0.00% | |
| GBP | -0.26% | -0.11% | -0.18% | -0.11% | 0.08% | 0.36% | -0.10% | |
| JPY | -0.09% | 0.05% | 0.18% | 0.07% | 0.24% | 0.52% | 0.06% | |
| CAD | -0.18% | -0.00% | 0.11% | -0.07% | 0.15% | 0.44% | -0.02% | |
| AUD | -0.34% | -0.18% | -0.08% | -0.24% | -0.15% | 0.28% | -0.18% | |
| NZD | -0.61% | -0.46% | -0.36% | -0.52% | -0.44% | -0.28% | -0.46% | |
| CHF | -0.15% | -0.01% | 0.10% | -0.06% | 0.02% | 0.18% | 0.46% |
The heat map shows percentage changes of major currencies against each other. The base currency is picked from the left column, while the quote currency is picked from the top row. For example, if you pick the Japanese Yen from the left column and move along the horizontal line to the US Dollar, the percentage change displayed in the box will represent JPY (base)/USD (quote).
Author

Christian Borjon Valencia
FXStreet
Markets analyst, news editor, and trading instructor with over 14 years of experience across FX, commodities, US equity indices, and global macro markets.


