|

USD/JPY Price Analysis: Clings to 124.00 as bulls aim to break the YTD high at 125.10

  • The USD/JPY ended the week on the right foot, gaining 1.42%.
  • High US Treasury yields underpinned the USD/JPY pair.
  • USD/JPY Price Forecast: The pair is upward biased, but it might correct courtesy of RSI showing overbought conditions.

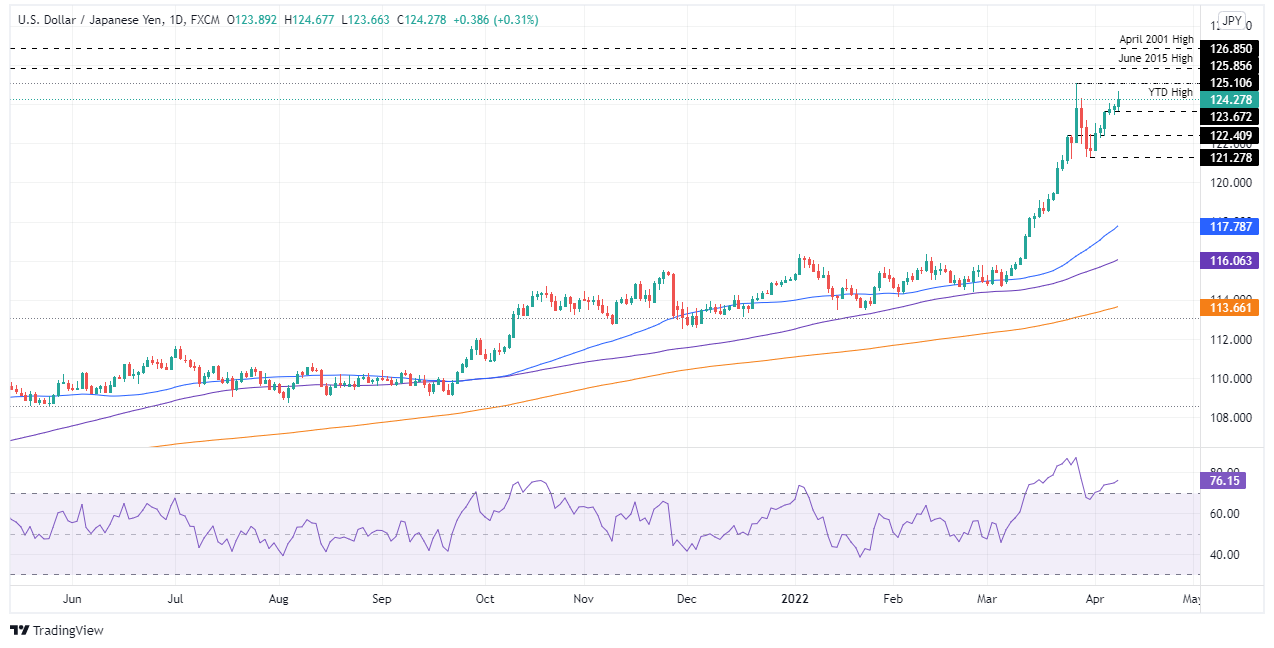
The USD/JPY is set to finish the week above the 124.00 mark for the first time in the year, though short of the YTD high at 125.10, amid a mixed market mood and upward pressured US Treasury yields. At the time of writing, the USD/JPY is trading at 124.27

US equities closed mixed, portraying the market sentiment. US Treasury yields rose, led by the 10-year benchmark note rate up to four and a half basis points, sat at 2.706%, a tailwind for the USD/JPY due to its positive correlation. If yields rise, the USD/JPY pair does it too.

On Friday, the USD/JPY opened around 123.90 but then fell towards the mid-pòint between the S1-Daily pivot point at 123.67, a price level where bulls took charge and lifted the pair towards fresh weekly highs at 124.67.

USD/JPY Price Forecast: Technical outlook

The USD/JPY remains upward biased. The daily moving averages (DMAs) reside well below the spot price, confirming the uptrend. However, the Relative Strenght Index (RSI) at 76.15 is aiming higher and at overbought levels, which means that the pair might be headed towards a correction before resuming up.

If the scenario of a lower correction plays out, the USD/JPY’s first support would be 124.00. A decisive break would expose 123.67. Once cleared, the next support would be March 244 daily high at 122.41.

Upwards, the USD/JPY’s first resistance will be 125.00, which once breached would send the pair towards the YTD high at 125.10, followed by June 2015 cycle highs near 125.85, and then the April 2001 swing high around 126.85.
USD/JPY

Overview
Today last price124.27
Today Daily Change0.42
Today Daily Change %0.34
Today daily open123.94
 
Trends
Daily SMA20121.15
Daily SMA50117.62
Daily SMA100115.98
Daily SMA200113.61
 
Levels
Previous Daily High124
Previous Daily Low123.47
Previous Weekly High125.1
Previous Weekly Low121.28
Previous Monthly High125.1
Previous Monthly Low114.65
Daily Fibonacci 38.2%123.8
Daily Fibonacci 61.8%123.67
Daily Pivot Point S1123.61
Daily Pivot Point S2123.27
Daily Pivot Point S3123.07
Daily Pivot Point R1124.14
Daily Pivot Point R2124.34
Daily Pivot Point R3124.68

Author

Christian Borjon Valencia

Markets analyst, news editor, and trading instructor with over 14 years of experience across FX, commodities, US equity indices, and global macro markets.


More from Christian Borjon Valencia
Share:

Editor's Picks

GBP/USD looks for direction around 1.3500

GBP/USD alternates gains with losses around the 1.3500 neighbourhood on Tuesday. That said, Cable struggles to extend its recent marked recovery in a context of continuous instability in the Middle East, which in turn keeps the Greenback well supported.

EUR/USD treads water around 1.1540

EUR/USD struggles to gather momentum on Tuesday, trading in an inconclusive fashion around 1.1540. Indeed, the pair’s price action comes amid the absence of clear direction in the US Dollar, as traders continue to closely follow developments in the Middle East.

Gold eases from tops, challenges $4,400

Gold retreats from its earlier tops and slips back below the key $4,400 mark per troy ounce on Tuesday. The precious metal’s marginal gains comes on the back of a sidelined price action in the US Dollar amid steady uncertainty from the geopolitical landscape.

Crypto Today: Bitcoin and Ethereum consolidate, XRP dips as optimism for a US-Iran deal fades

Bitcoin (BTC) maintains a neutral outlook on Tuesday while testing support at $64,000. Investors appear to be sitting on the fence, awaiting a catalyst for a breakout above $65,000.

The inflation narrative is still way more important than the employment story
Core bonds sold off yesterday with the belly of the curve slightly underperforming in the US while European curves showed more of a bear flattening. Daily changes on the US curve varied between +4.7 bps (2-yr) and +6.4 bps (7-yr).
9-3: Is the Federal Reserve’s vote tally Warsh's new forward guidance?
The rate did not move. Neither did the statement, and that’s the more interesting fact. Set the July 29 Federal Open Market Committee (FOMC) statement beside the one issued on June 17, and the two documents are identical apart from a single verb and a paragraph at the bottom naming three dissenters.