|

USD/JPY Price Analysis: Buyers loose steam and pullback from 24-year high

  • USD/JPY gained 1.80% in the week, extending its rally to the seventh consecutive week.
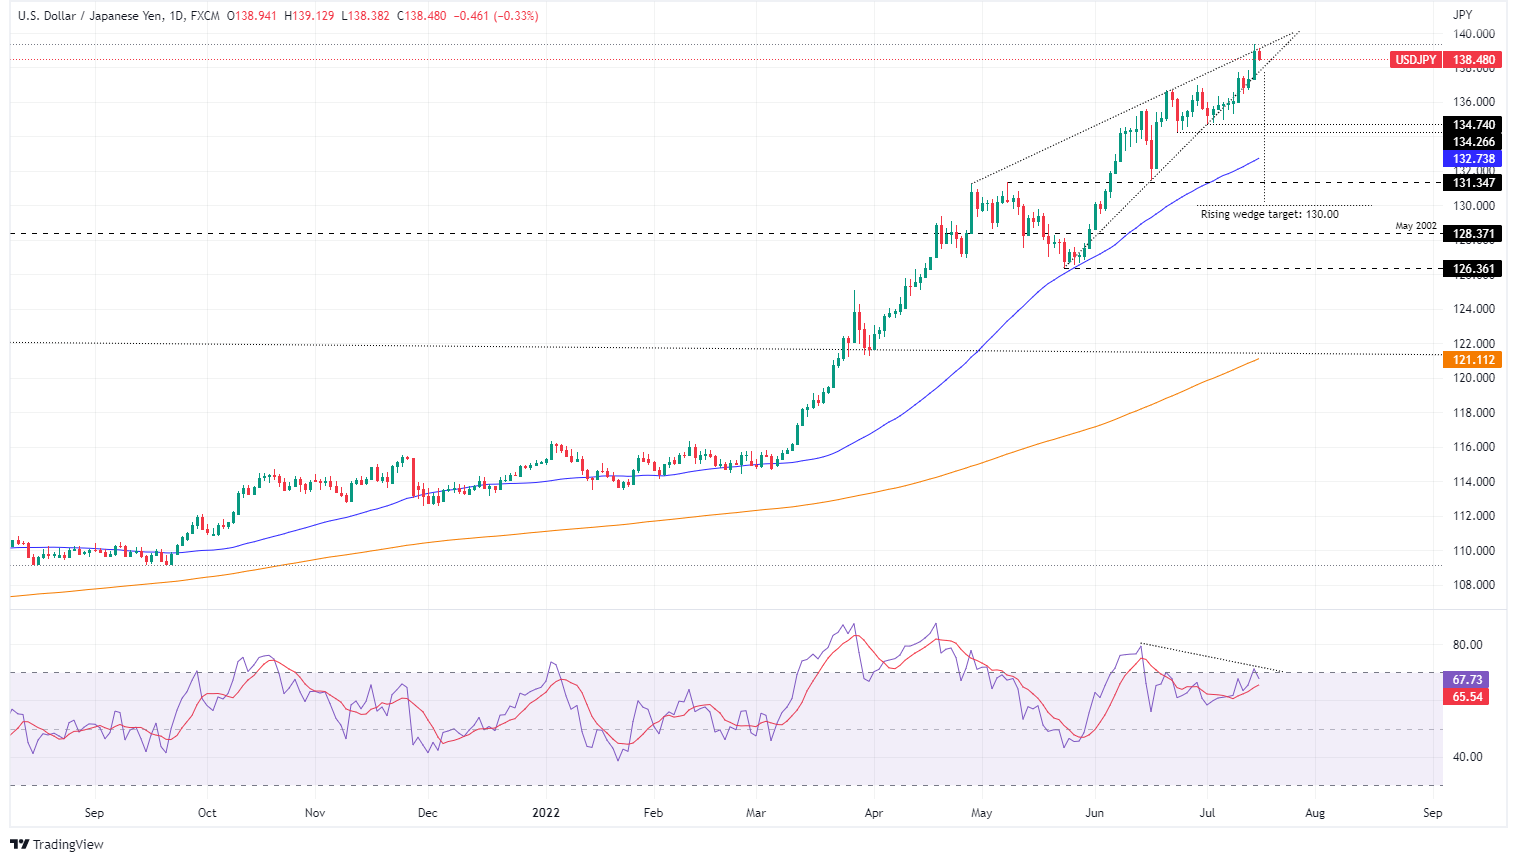
  • USD/JPY Price Analysis: Divergence between price action and RSI spurred a pullback, though a daily close below 137.70 would tumble the USD/JPY towards 134.26.

The USD/JPY retreats from YTD highs at around 139.38, towards the middle of the 138.00-139.00 range on Friday, as Wall Street closes the week with gains between 1.83% and 2.15%, underpinned by upbeat data that could deter Federal Reserve members from hiking 100 bps in the July meeting.

The USD/JPY is trading at 138.48, down 0.33% after beginning Friday’s session around the 139.00 figure, nearly daily highs, to then slide to the daily’s central pivot point at 138.54, where the major stabilized, ahead into the weekend.

USD/JPY Price Analysis: Technical outlook

USD/JPY Daily Chart

The USD/JPY remains upward biased, but price action remains overextended. That means that USD/JPY still favors longs, but the Relative Strength Index (RSI) formed a negative divergence and exited from overbought conditions. That said, the USD/JPY could retrace from the YTD highs to its next support level at July 11 high-turned-support at 137.75.

If the above scenario plays out, the USD/JPY next support would be 137.00. The break below will expose the July 1 daily low at 134.74, followed by the June 23 low at 134.26. on the other hand, the USD/JPY’s first resistance would be the 139.00 figure. A breach of the latter would expose the YTD high at 139.38, followed by 140.00.

USD/JPY Key Technical Levels

USD/JPY

Overview
Today last price138.48
Today Daily Change-0.36
Today Daily Change %-0.26
Today daily open138.96
 
Trends
Daily SMA20136.11
Daily SMA50132.61
Daily SMA100127.65
Daily SMA200121
 
Levels
Previous Daily High139.39
Previous Daily Low137.28
Previous Weekly High136.56
Previous Weekly Low134.78
Previous Monthly High137
Previous Monthly Low128.65
Daily Fibonacci 38.2%138.59
Daily Fibonacci 61.8%138.09
Daily Pivot Point S1137.7
Daily Pivot Point S2136.44
Daily Pivot Point S3135.59
Daily Pivot Point R1139.81
Daily Pivot Point R2140.65
Daily Pivot Point R3141.92

Author

Christian Borjon Valencia

Markets analyst, news editor, and trading instructor with over 14 years of experience across FX, commodities, US equity indices, and global macro markets.

More from Christian Borjon Valencia
Share:

Editor's Picks

EUR/USD stays well offered below 1.1800

The selling pressure on EUR/USD is picking up pace, with the pair slipping decisively below the key 1.1800 level and sliding to fresh two week lows as Wednesday’s session draws to a close. The move lower comes as the US Dollar finds renewed strength after the latest round of US data and the release of the FOMC Minutes. Next of note on the docket will be the US weekly Initial Jobless Claims.
 

GBP/USD reaches multi-day lows near 1.3500

GBP/USD reverses its initial upside momentum and is now adding to previous declines, approaching the 1.3500 region on Wednesday. Cable’s downtick comes on the back of decent gains in the Greenback and easing UK inflation figures, which seem to have reinforced the case for a BoE rate cut in March.

Gold battle to regain $5,000 continues

Gold is back on the front foot on Wednesday, shaking off part of the early week softness and challenging two-day highs near the $5,000 mark per troy ounce. The move comes ahead of the FOMC Minutes and is unfolding despite an intense rebound in the US Dollar.

Bitcoin has found or is near a bottom, extended consolidation to follow: K33

Bitcoin (BTC) is nearing or has already established a bottom, which could be followed by a sustained period of slow price movement, according to K33.

Mixed UK inflation data no gamechanger for the Bank of England

Food inflation plunged in January, but service sector price pressure is proving stickier. We continue to expect Bank of England rate cuts in March and June. The latest UK inflation read is a mixed bag for the Bank of England, but we doubt it drastically changes the odds of a March rate cut.

Sui extends sideways action ahead of Grayscale’s GSUI ETF launch

Sui is extending its downtrend for the second consecutive day, trading at 0.95 at the time of writing on Wednesday. The Layer-1 token is down over 16% in February and approximately 34% from the start of the year, aligning with the overall bearish sentiment across the crypto market.