USD/JPY Price Analysis: Bulls throwing in the towel, 38.2% Fibo eyed?
- USD/JPY bears are moving in and eye a correction.
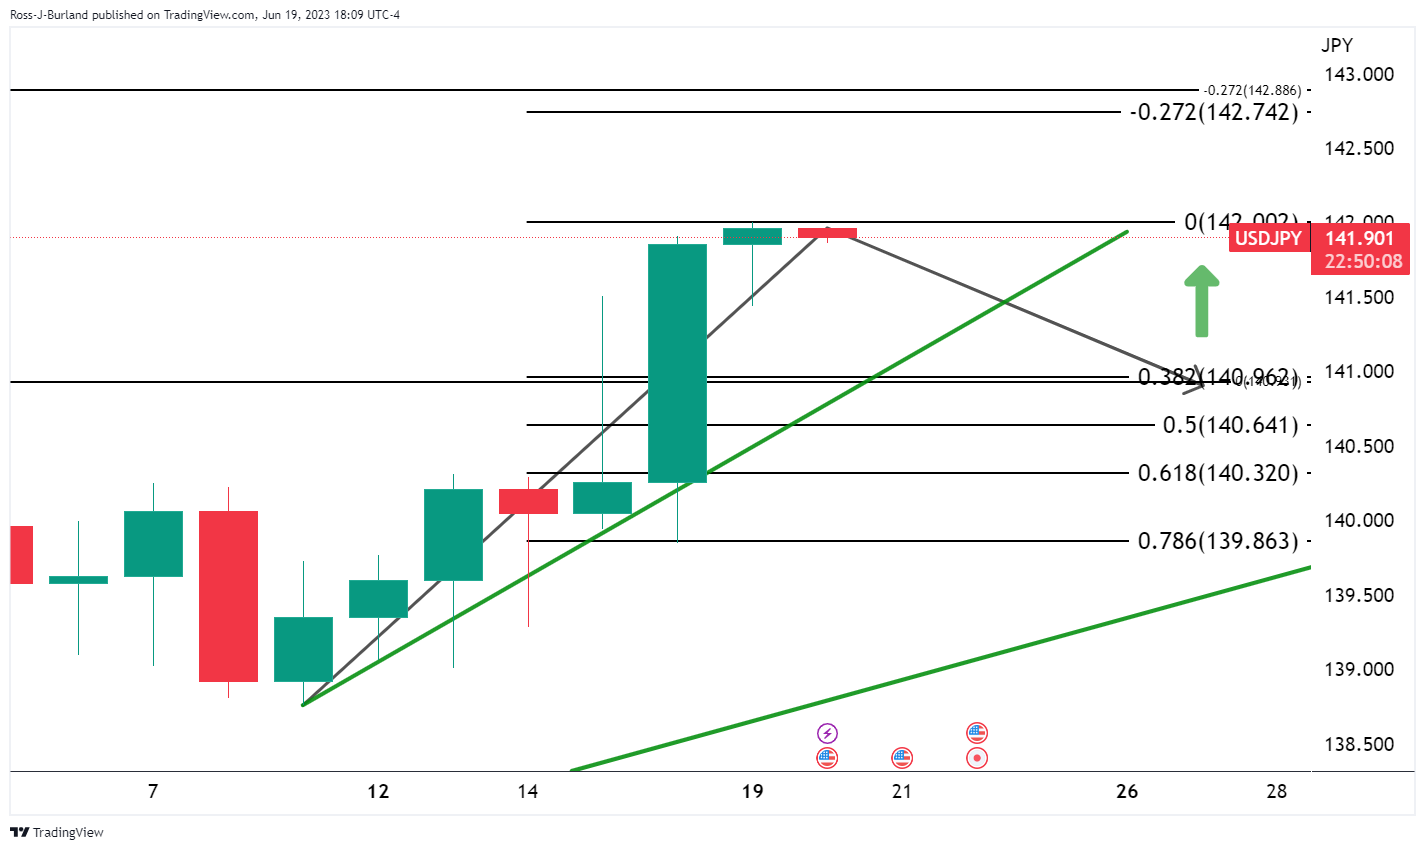
- The 38.2% Fibonacci is exposed to the downside.

The US Dollar edged higher forcing the Yen into submission at the start of the week at around 141.96 the highs in USD/JPY. The following is a technical analysis that illustrates the prospects of a continuation longer term to the upside but in the near-term, possibilities of a meanwhile correction.
USD/JPY monthly chart

The W-formation is shaping up on the monthly chart and there is space into the prior highs.
USD/JPY weekly chart

The weekly support line is in tact and this too leaves the bullish bias in play.
USD/JPY daily chart
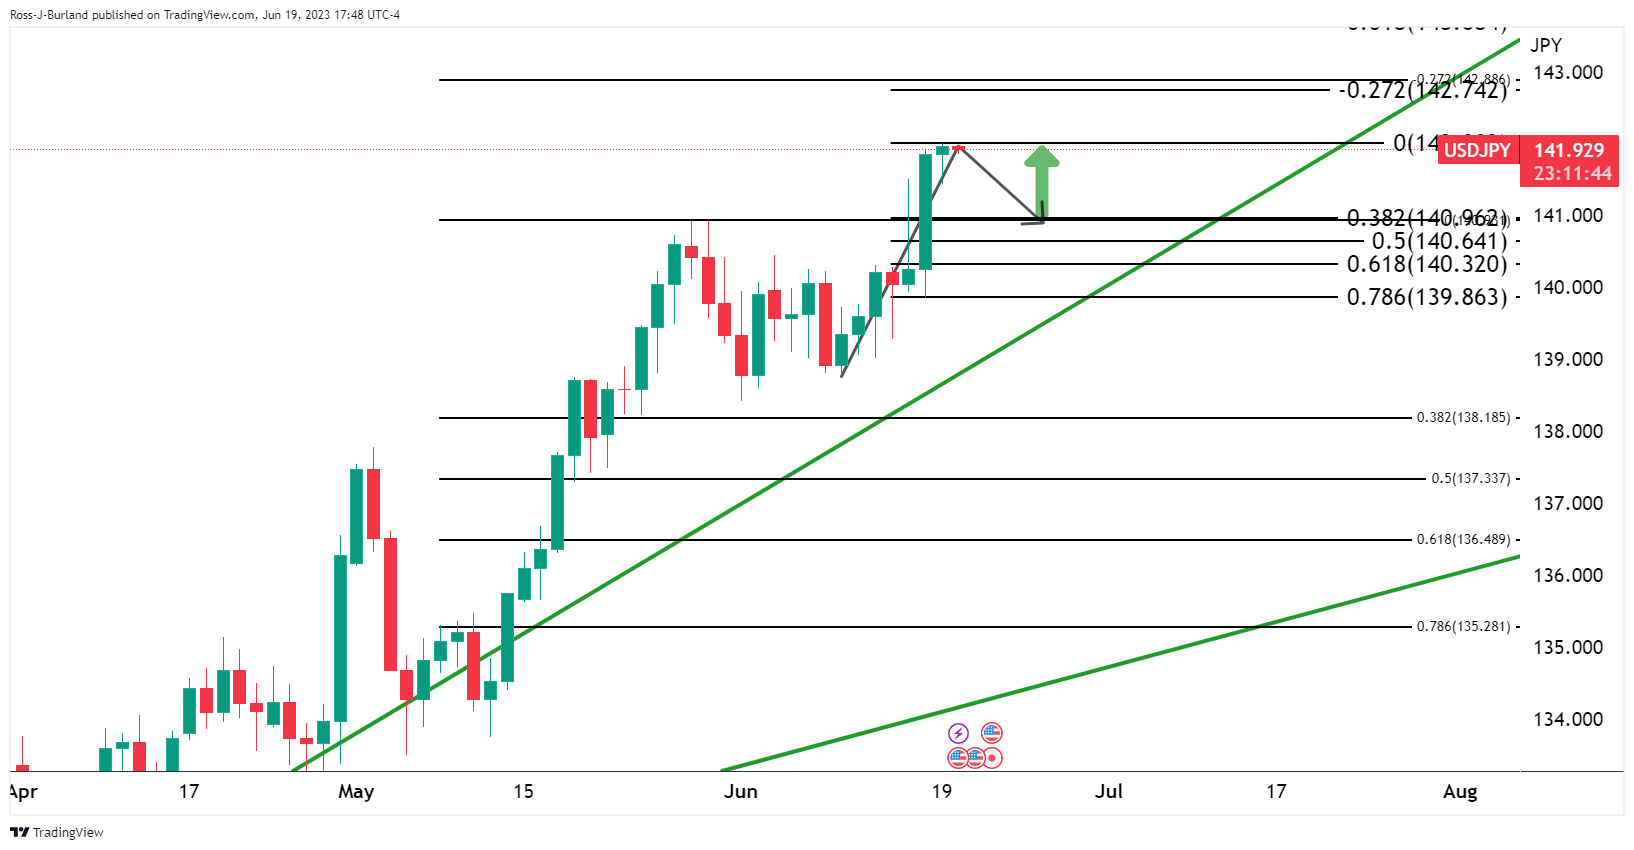
The bears, however, could be about to move in which leaves the Fibonacci scale open for mitigation to the downside and move to test near-term trendline support.
Author

Ross J Burland
FXStreet
Ross J Burland, born in England, UK, is a sportsman at heart. He played Rugby and Judo for his county, Kent and the South East of England Rugby team.


