Top 3 Price Prediction: Bitcoin, Ethereum, Ripple – BTC, ETH, XRP at risk as US-Iran war extends
- Bitcoin risks dropping below $71,000 on Friday after a 2% reversal from the 50-day EMA on Thursday.
- Ethereum hovers above $2,000 on Friday, testing a crucial psychological support after Thursday’s 2% drop.
- XRP hovers around $1.40, extending consolidation below $1.50 for nearly a month.

Bitcoin (BTC), Ethereum (ETH), and Ripple (XRP) trade cautiously at press time on Friday, close to key support levels after a roughly 2% pullback the previous day. Bitcoin holds above $71,000, Ethereum at $2,000, and XRP continues to consolidate in a sideways range. The top three cryptocurrencies by market capitalization struggle to maintain a directional trend, with the US-Iran war weighing on global market sentiment.
Bitcoin above $71,000 flags downside risk
Bitcoin is holding above $71,000 at press time on Friday, after a 2% drop the previous day. The near-term bias is slightly bearish as price reverses from the 50-day Exponential Moving Average (EMA) at $74,184, keeping the recovery in check.
The Moving Average Convergence Divergence (MACD) line remains above its signal line and in positive territory, with a still-elevated histogram suggesting buyers retain momentum. Meanwhile, the Relative Strength Index (RSI) is around 52, remaining neutral but slightly above the midline.
Immediate support is seen near the recent swing area around the 78.6% trend-based Fibonacci retracement level at $68,839, measured between the October 6 high of $126,199, November 21 low at $80,600, and the January 14 high at $97,924. A break below this zone would expose more meaningful downside toward $62,541 as the next support.
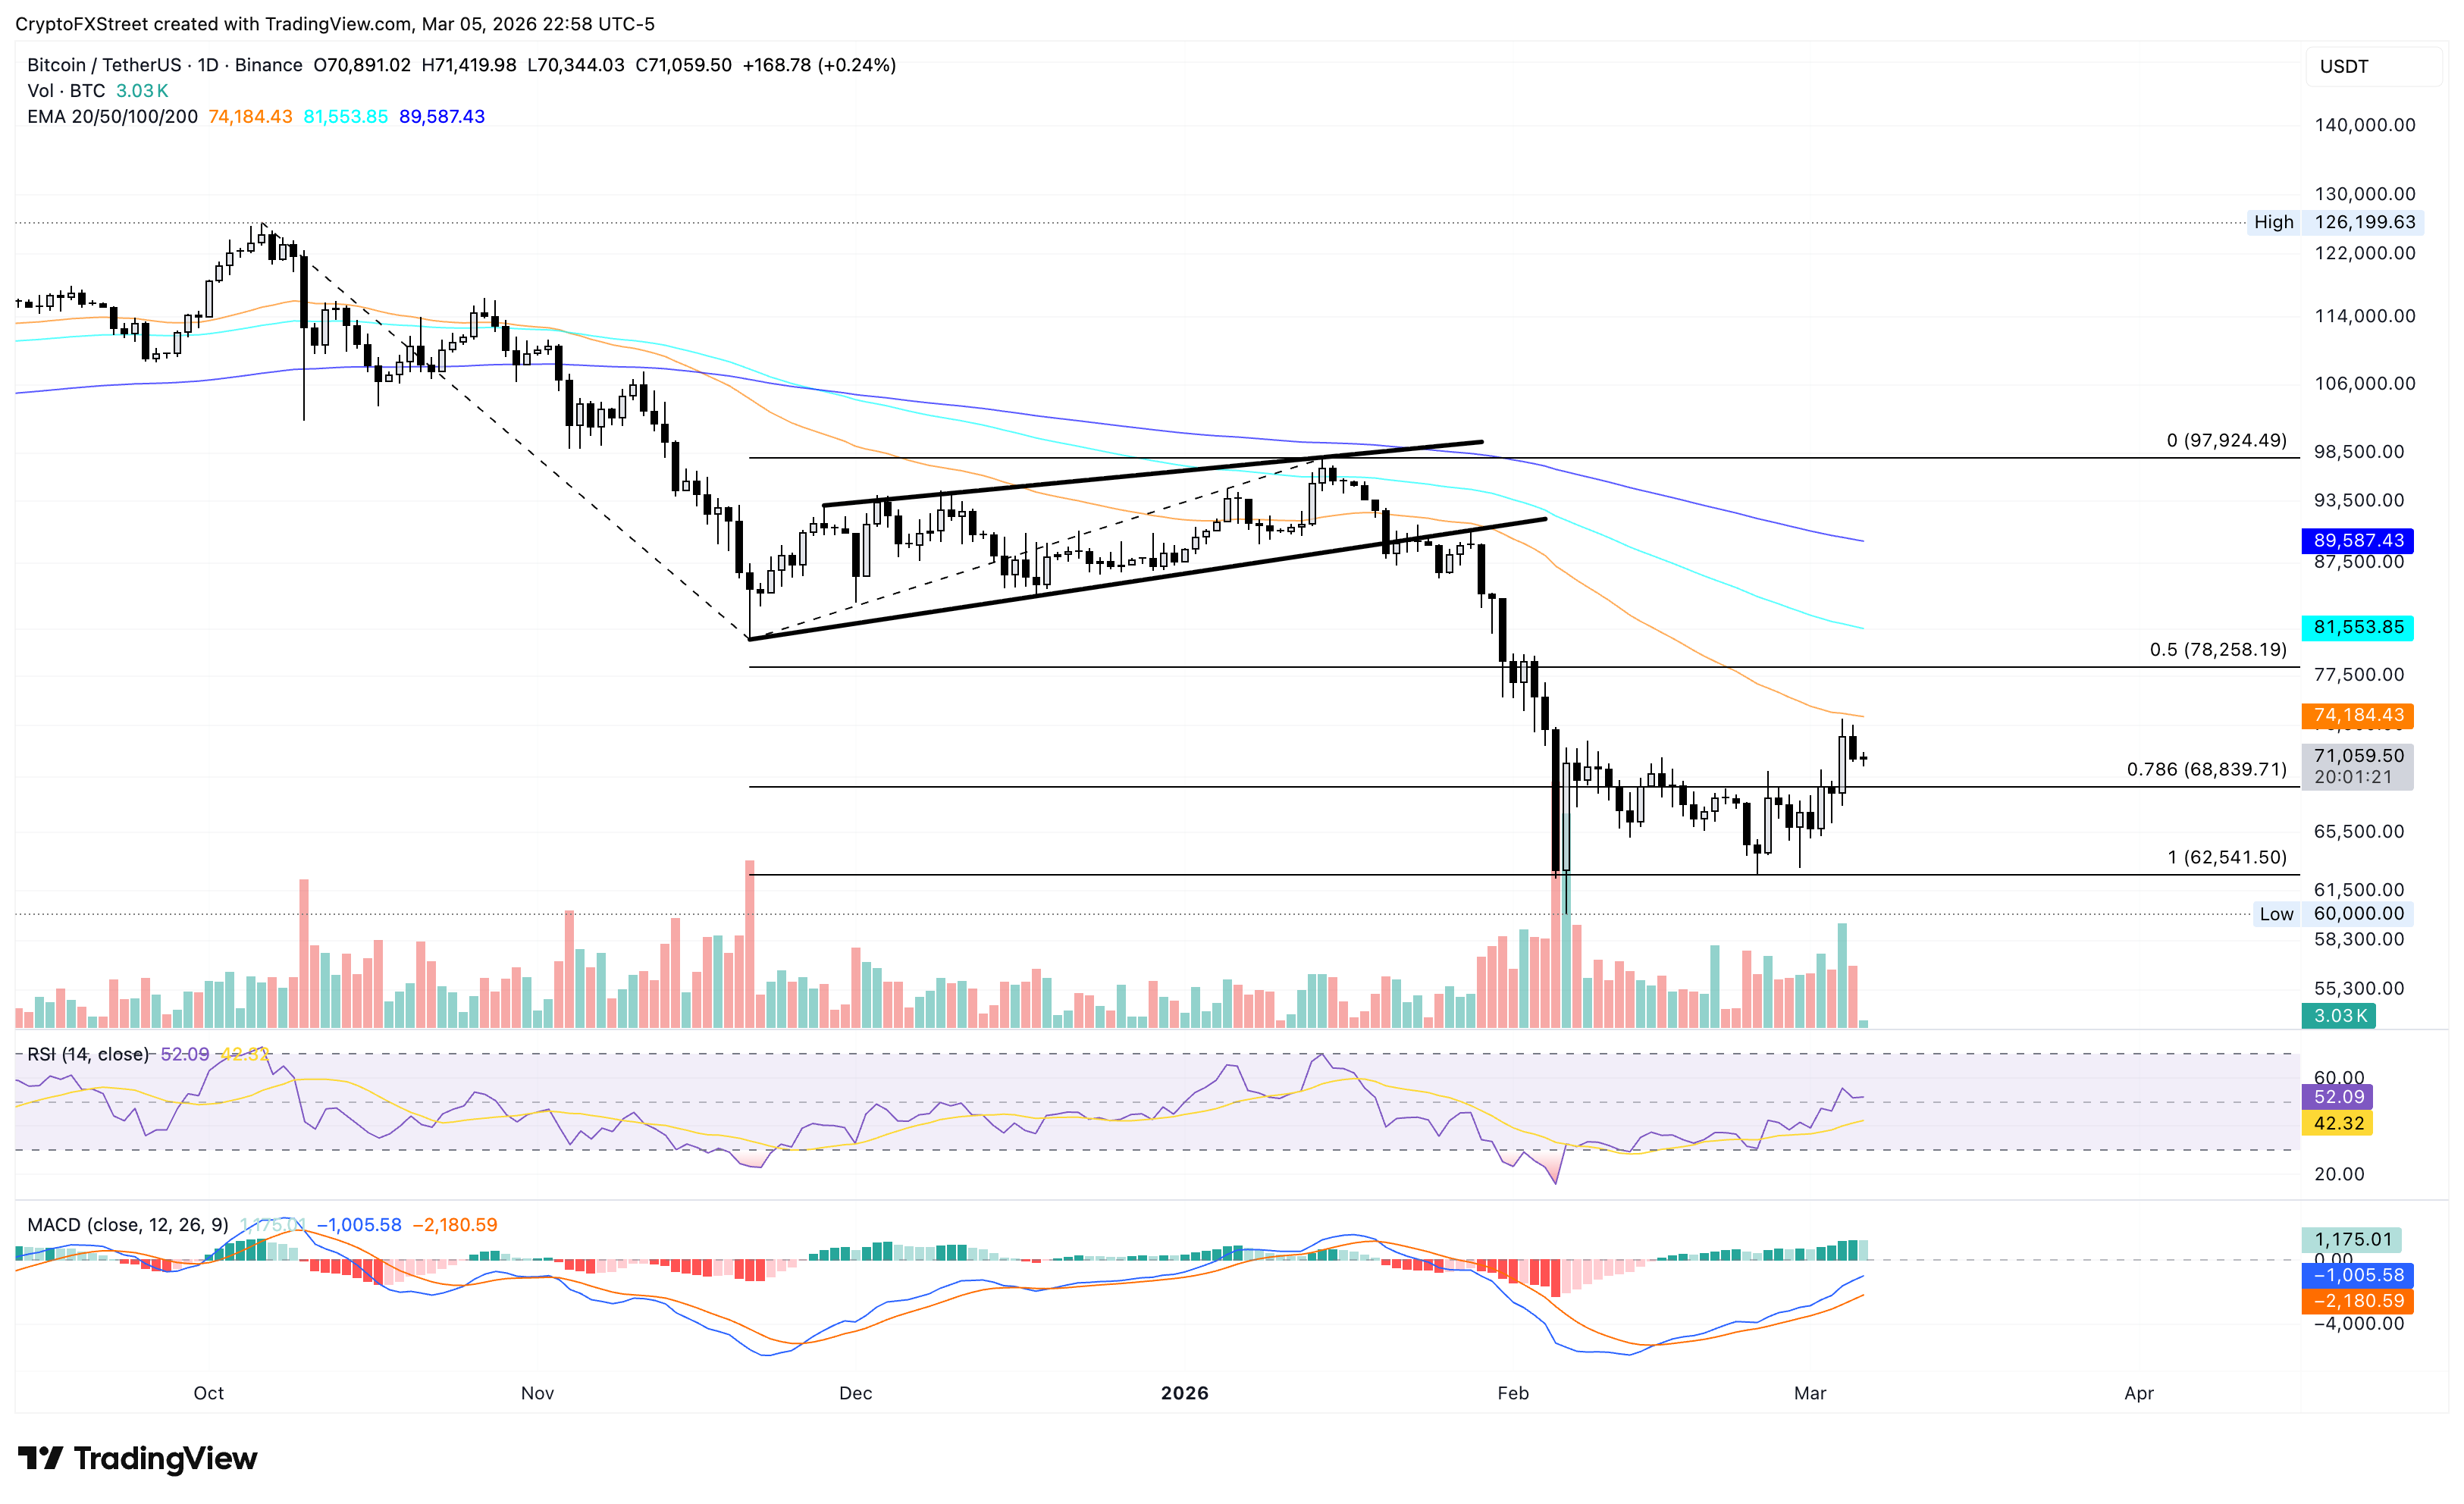
On the topside, the 50-day EMA at $74,184 stands as the initial resistance, and a daily close above it could open the way toward the 50% trend-based Fibonacci retracement level at $78,258.
Ethereum reverses from key resistance, risking the $2,000 mark
Ethereum is trading above $2,000 at the time of writing on Friday. The near-term bias is mildly bearish as ETH reverses 2% on Thursday before reaching the 50-day EMA, while the descending 100- and 200-day EMAs still frame a broader downtrend.
The MACD remains above its signal line and in positive territory, though the waning histograms suggest slowing upside pressure. The RSI at 49 underscores this equilibrium, showing neutral conditions and aligning with a consolidative phase.
An extended pullback in Ethereum could find support near the recent swing low at $1,747 from February 6, which could serve as immediate support.
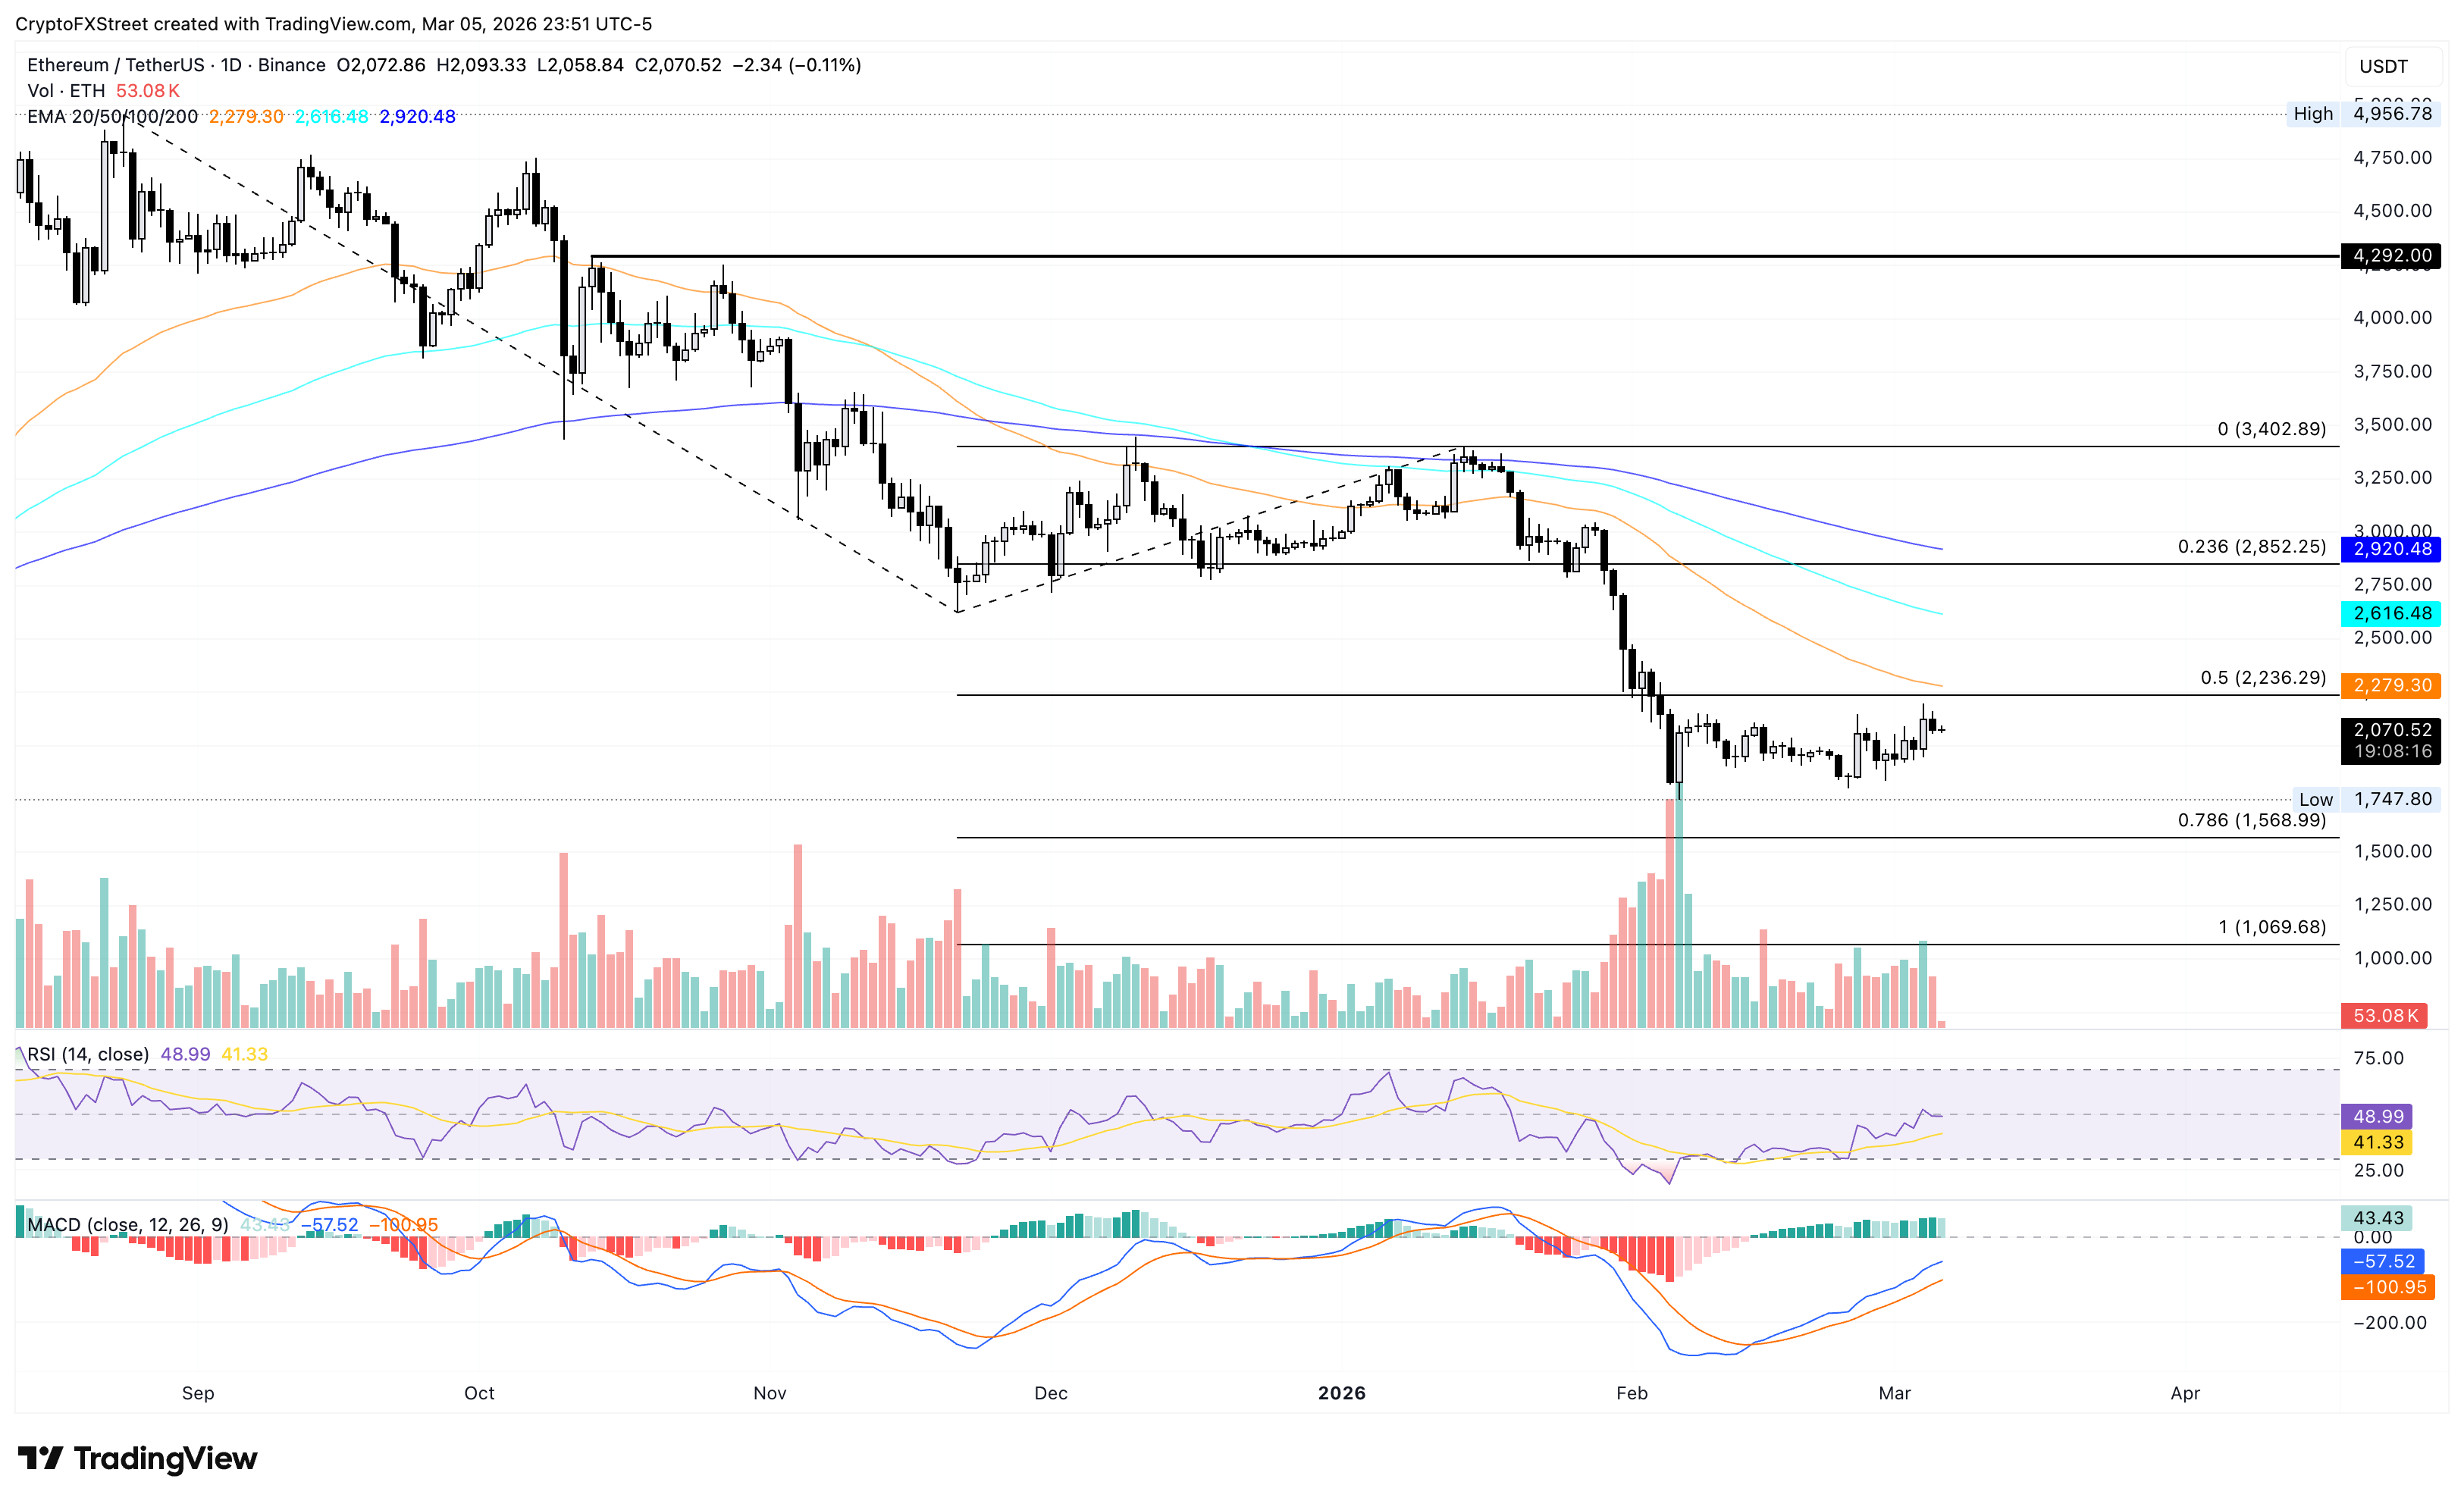
Looking up, the cluster of the 50-day EMA at $2,279 and the 50% trend-based retracement level at $2,236, measured between the August 24 high at $4,956, the November 21 low at $2,623, and the January 14 high at $3,402, serves as overhead resistance. A daily close above this zone could test the 100-day EMA at $2,616.
XRP loses strength within a consolidation range
Ripple hovers around $1.40 at press time on Friday, trading well below the 50-, 100-, and 200-day EMAs, all of which slope lower and underscore a dominant bearish backdrop. Additionally, a long-running descending resistance trend line continues to frame the broader downtrend.
The MACD remains marginally above the signal and zero lines, while the RSI at 45 suggests only a cooling of selling pressure.
XRP maintains a consolidation range between $1.50 and $1.33 on the daily chart. A decisive close above $1.50 could test the 50-day EMA at $1.56.
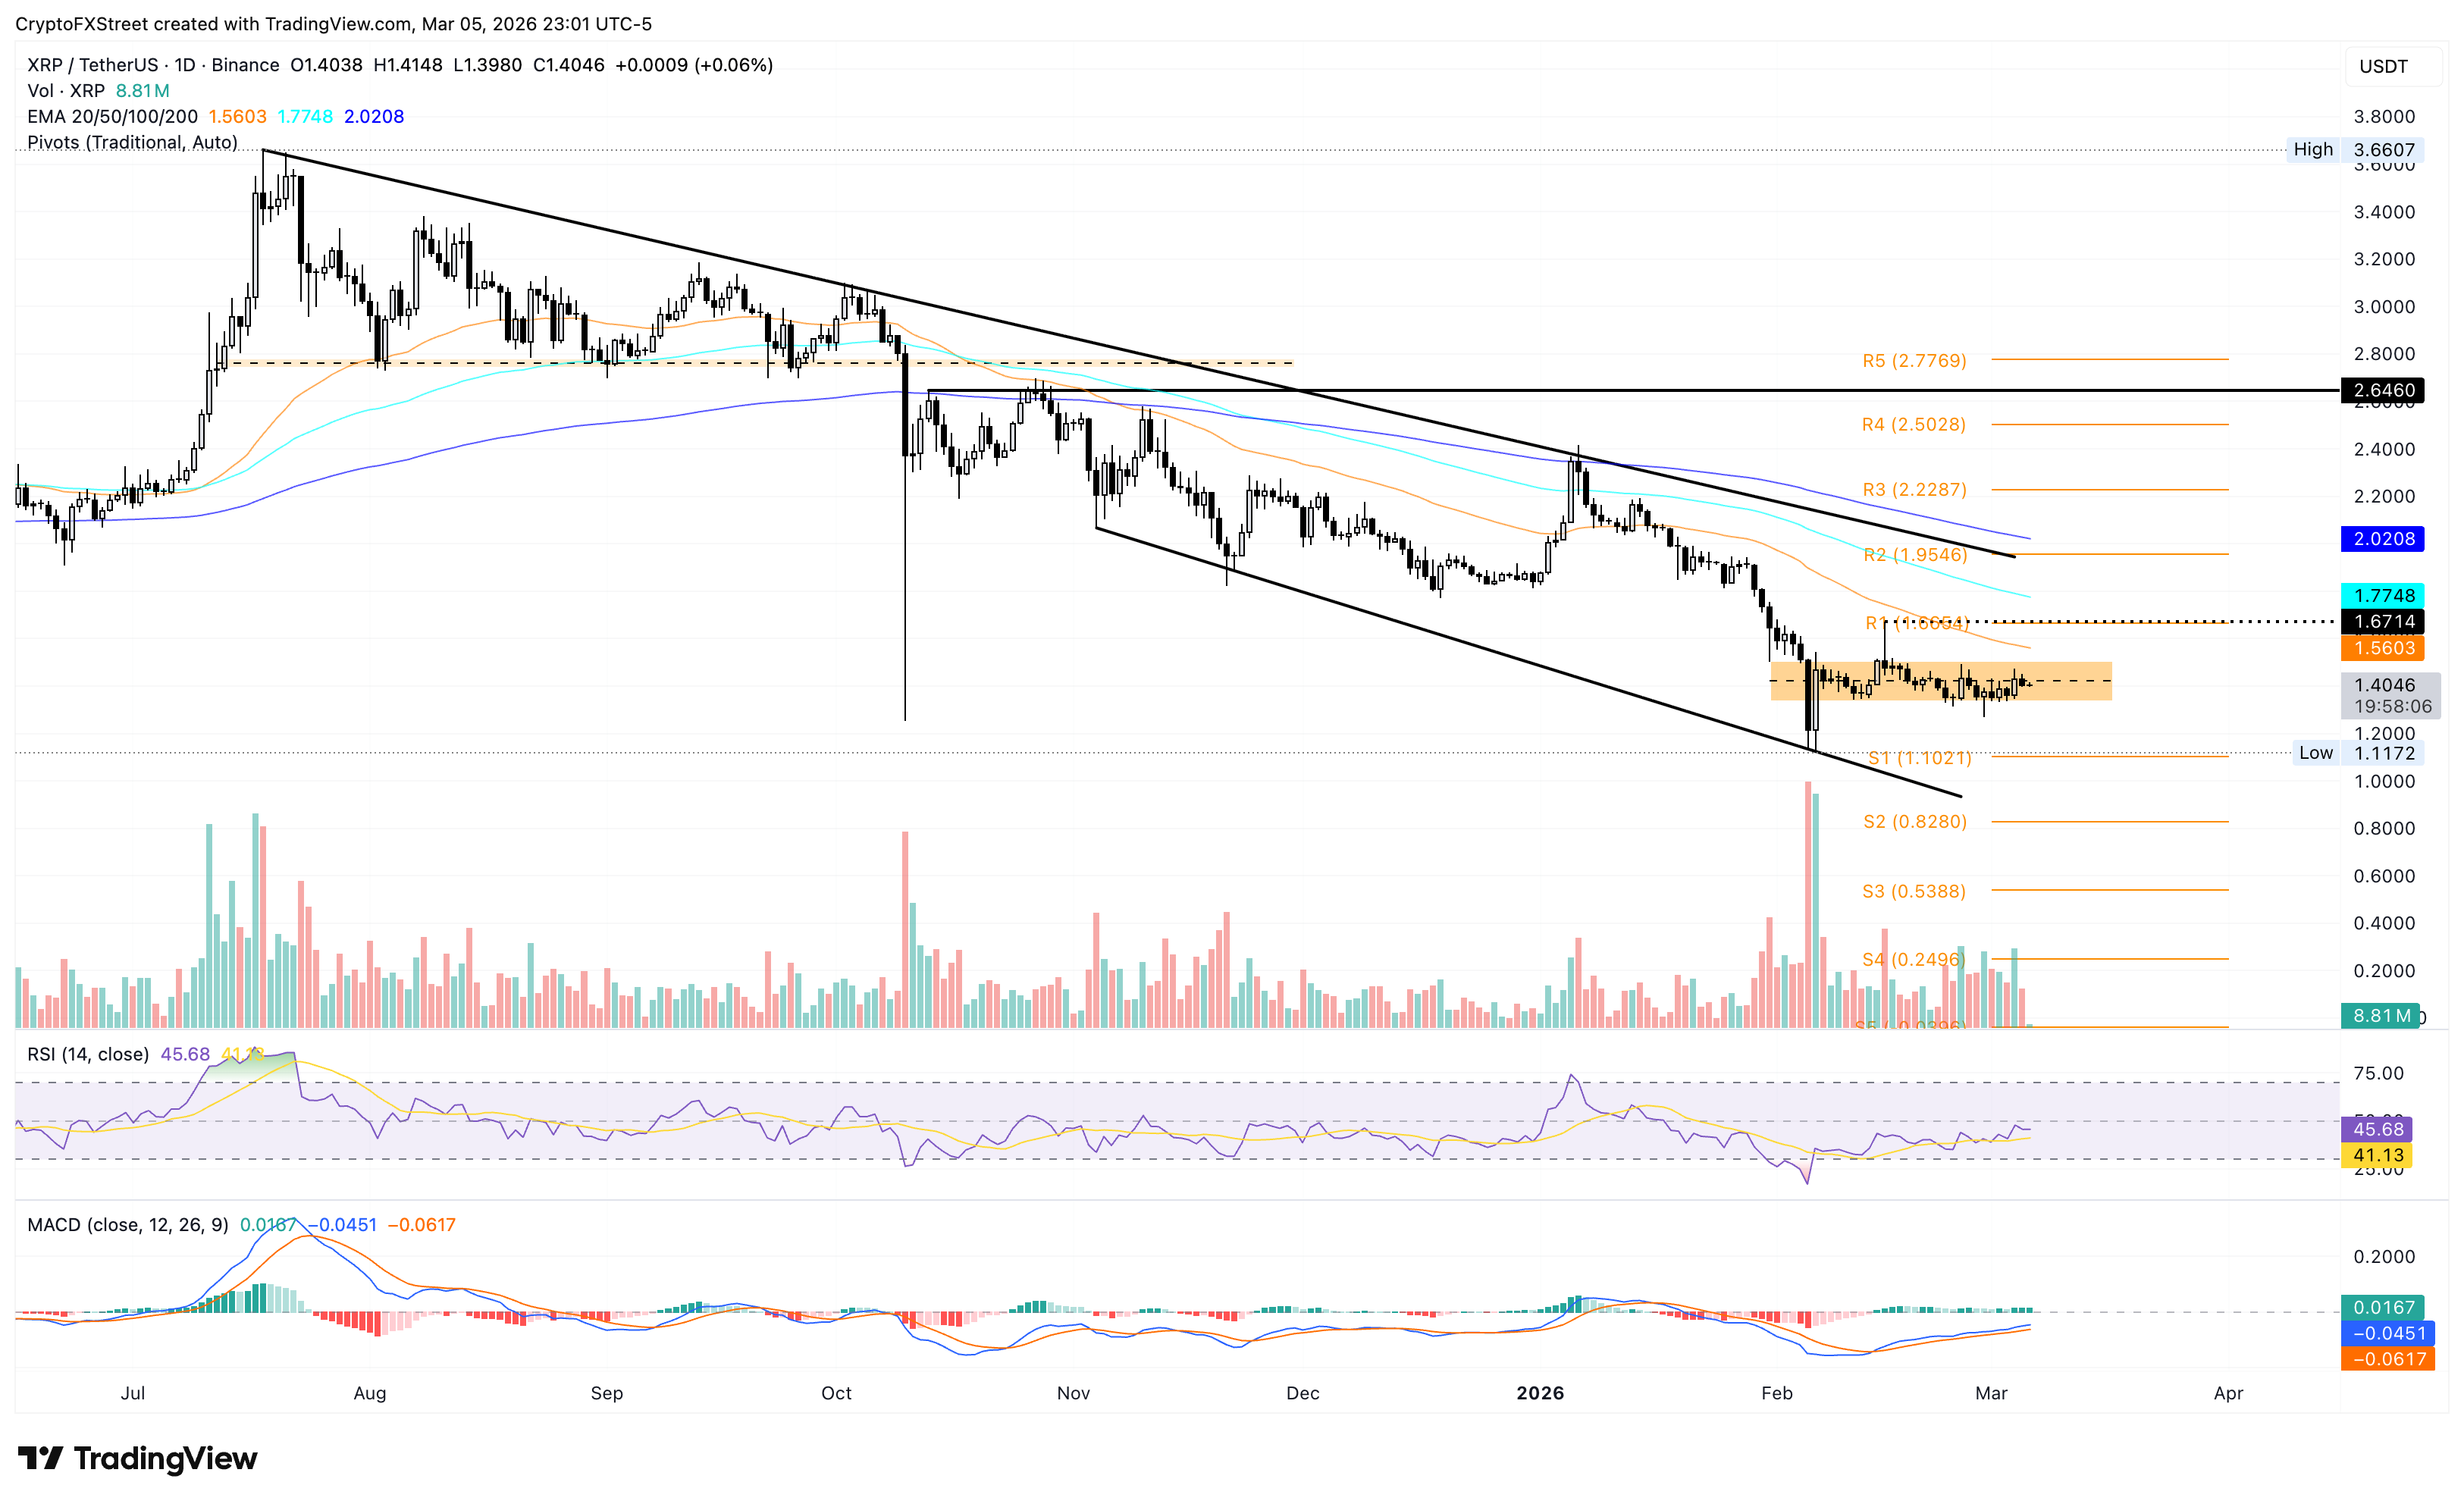
However, if XRP slips below $1.33, it could extend the downside risk to the S1 Pivot Point at $1.10.
(The technical analysis of this story was written with the help of an AI tool.)
Author

Vishal Dixit
FXStreet
Vishal Dixit holds a B.Sc. in Chemistry from Wilson College but found his true calling in the world of crypto.



