USD/JPY Price Analysis: Bulls emerge from behind the hourly trendline
- USD/JPY bears are in control as the price corrects the daily bullish impulse.
- The bulls are taking on the trendline resistance on the lower time frames.

USD/JPY has scored fresh highs in the latest bullish impulse within the bull cycle. However, a correction is taking place and the following illustrates the prospects of a deeper move prior to a move back to the upside in the coming week.
USD/JPY daily chart
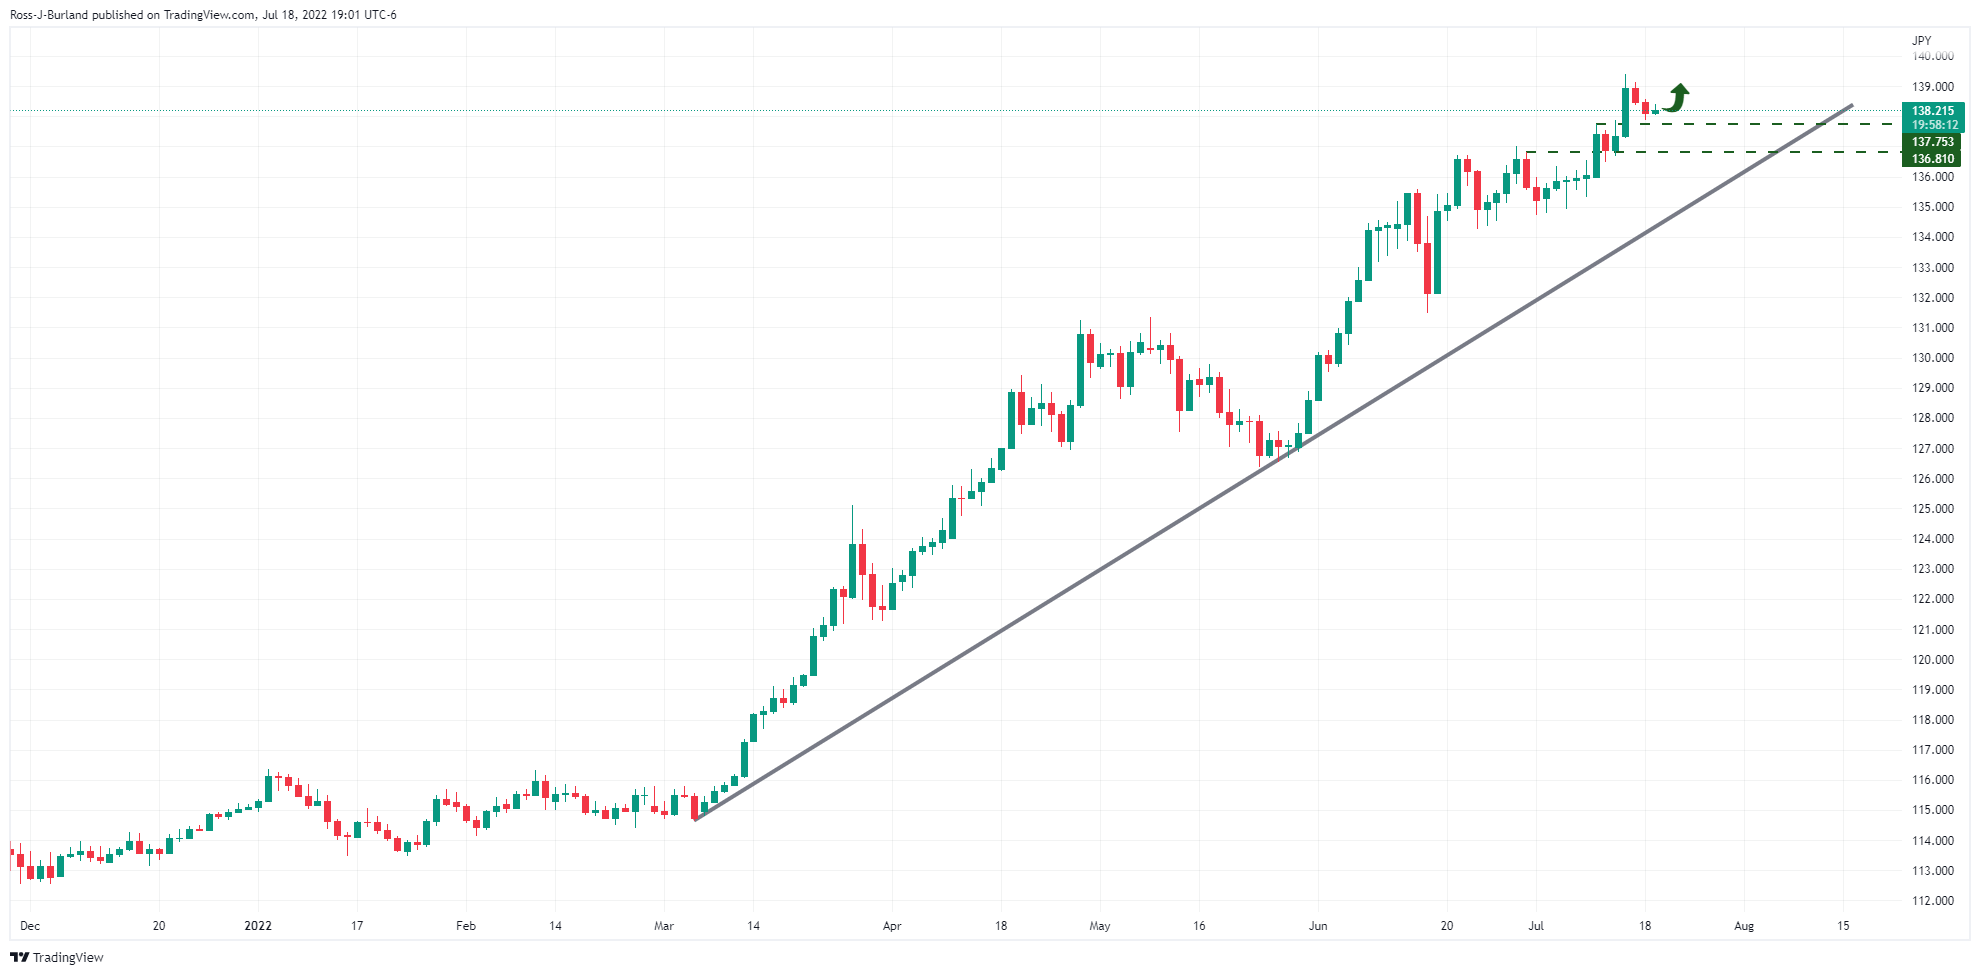
USD/JPY is in the hands of the bears in a correction of the latest bullish impulse on the daily chart.
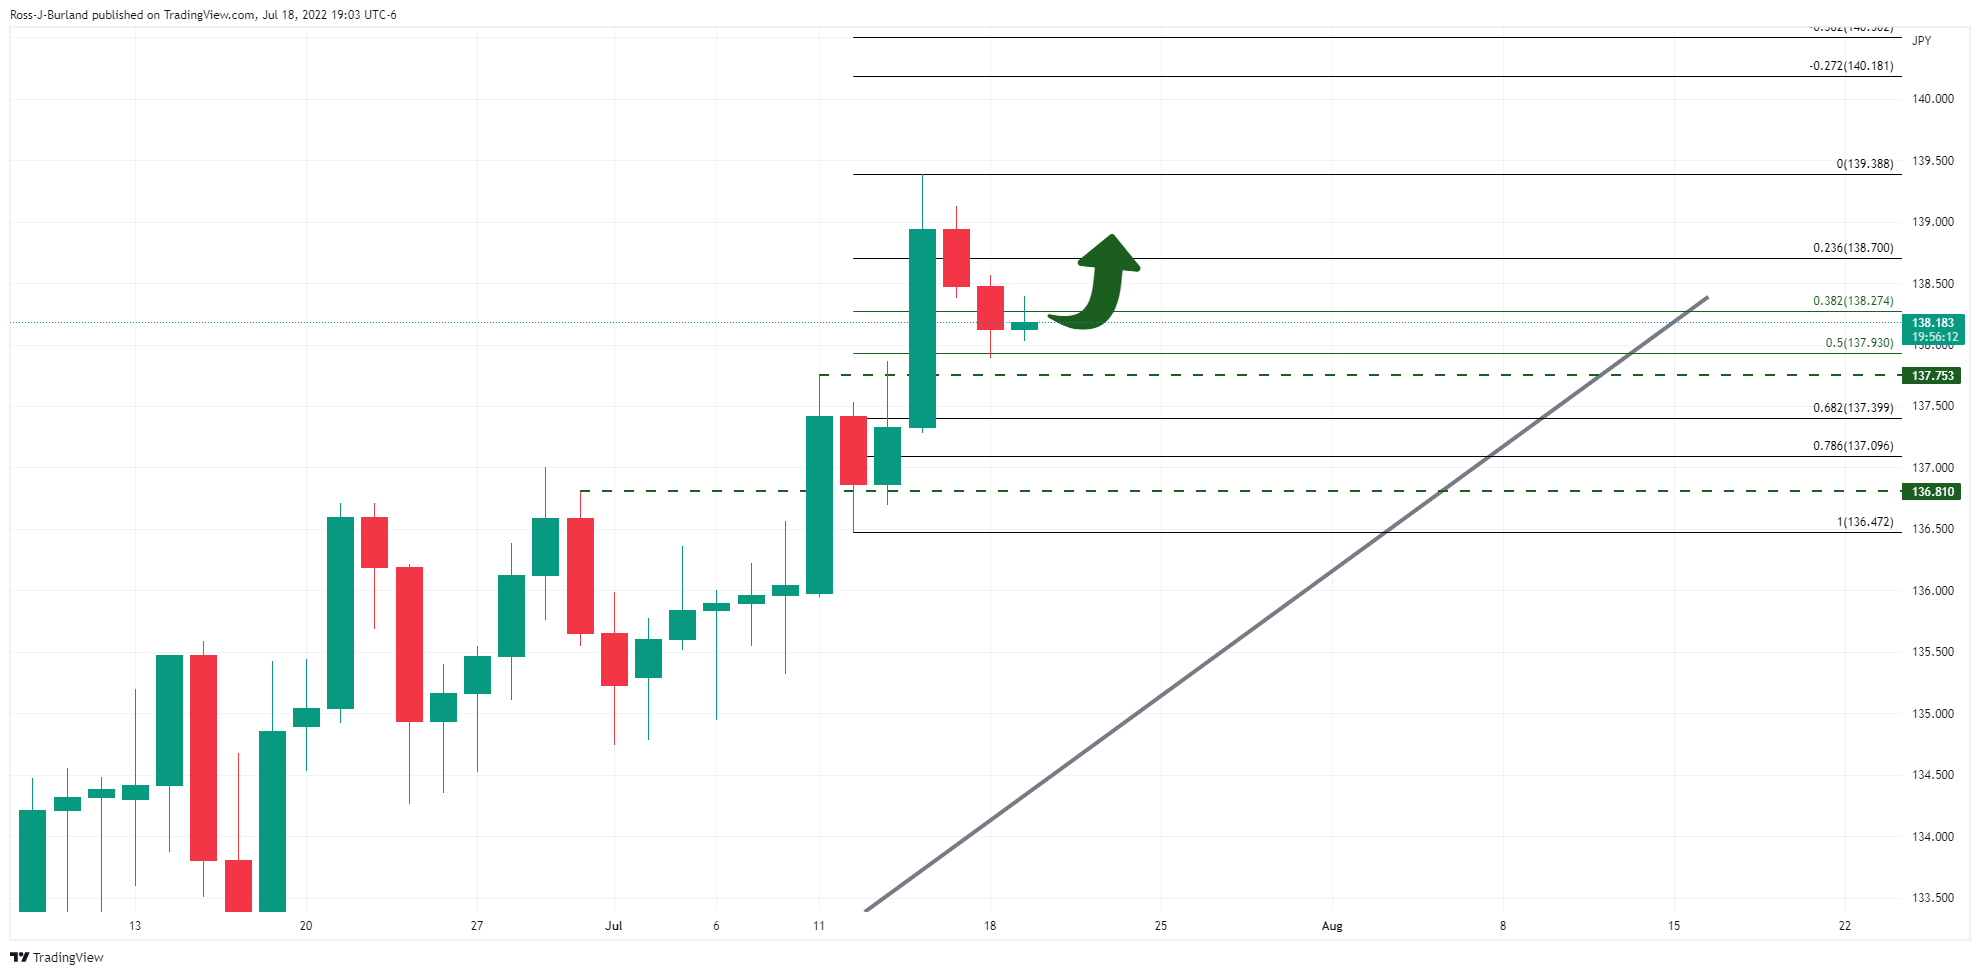
Zoomed in, the price is en route to a key area of support on the Fibonacci scale
USD/JPY H1 charts
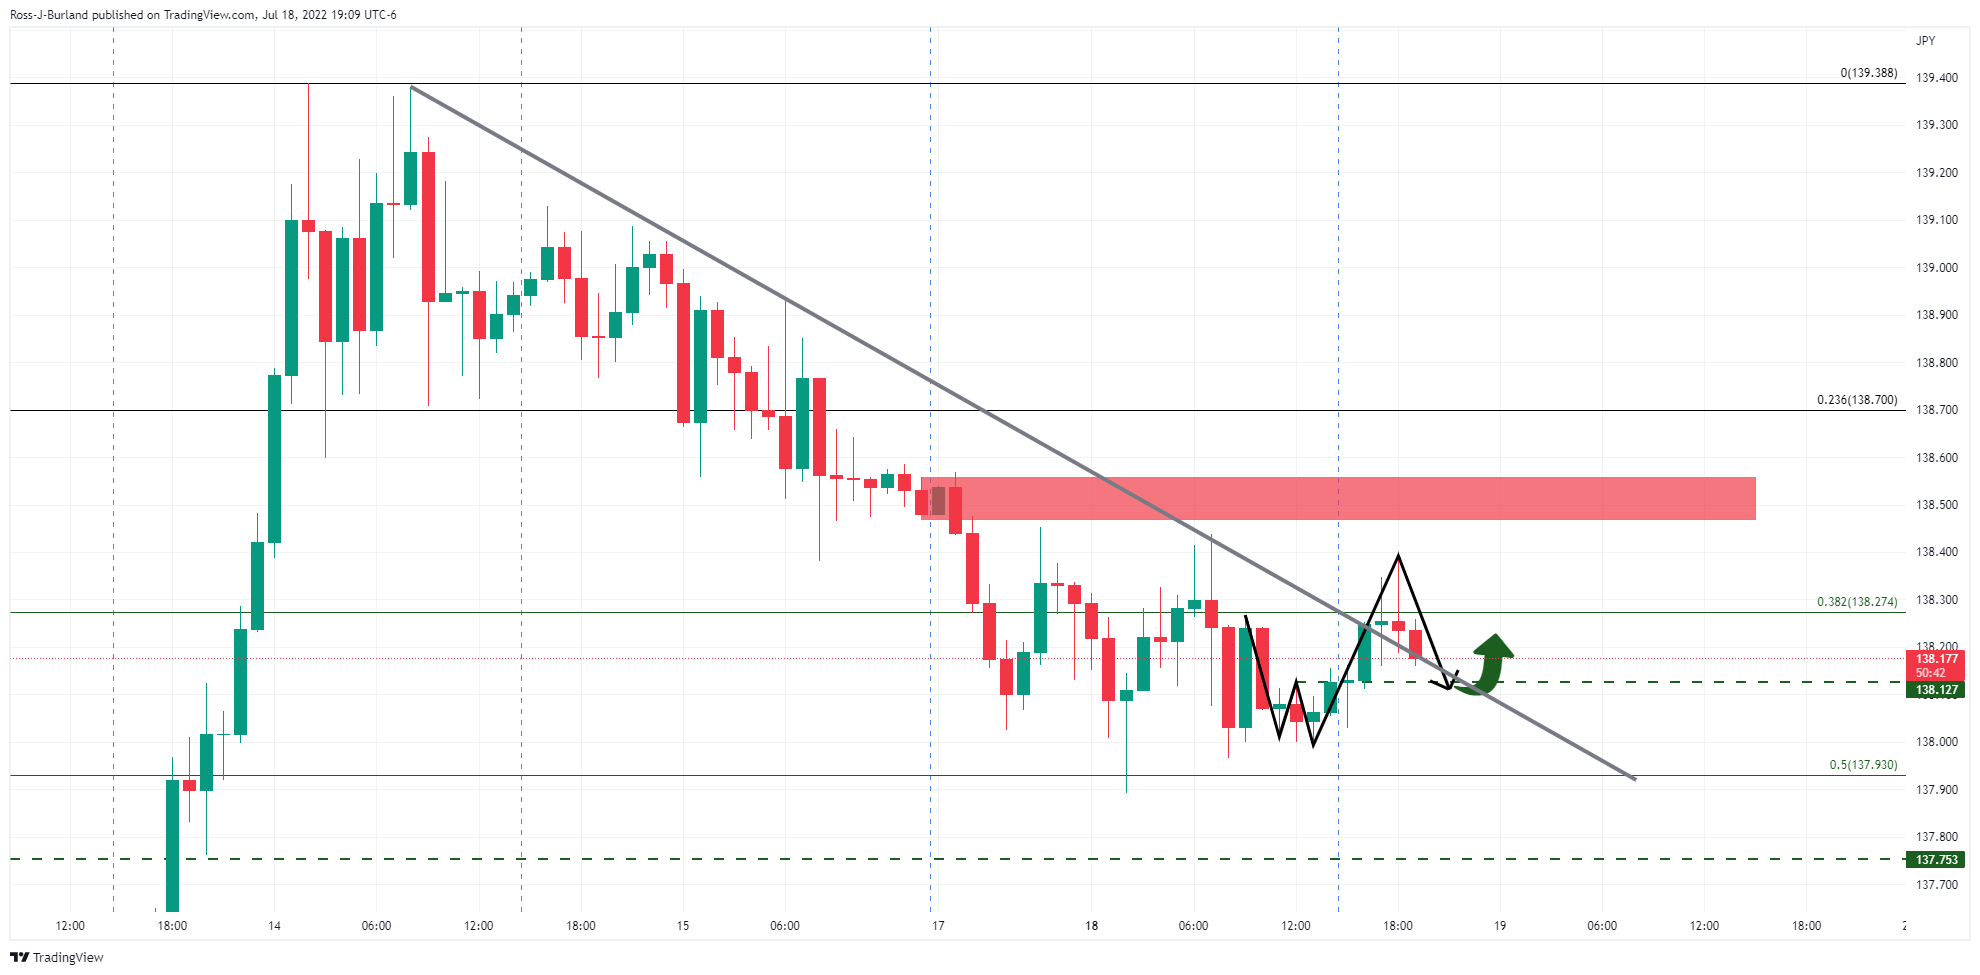
We have a reversion taking place on the hourly chart as the bulls attempt to move out beyond the trendline resistance.
Zoomed in, the W formation's neckline aligns with the 61.8% Fibonacci of the bullish impulse which has pierced the trendline resistance.
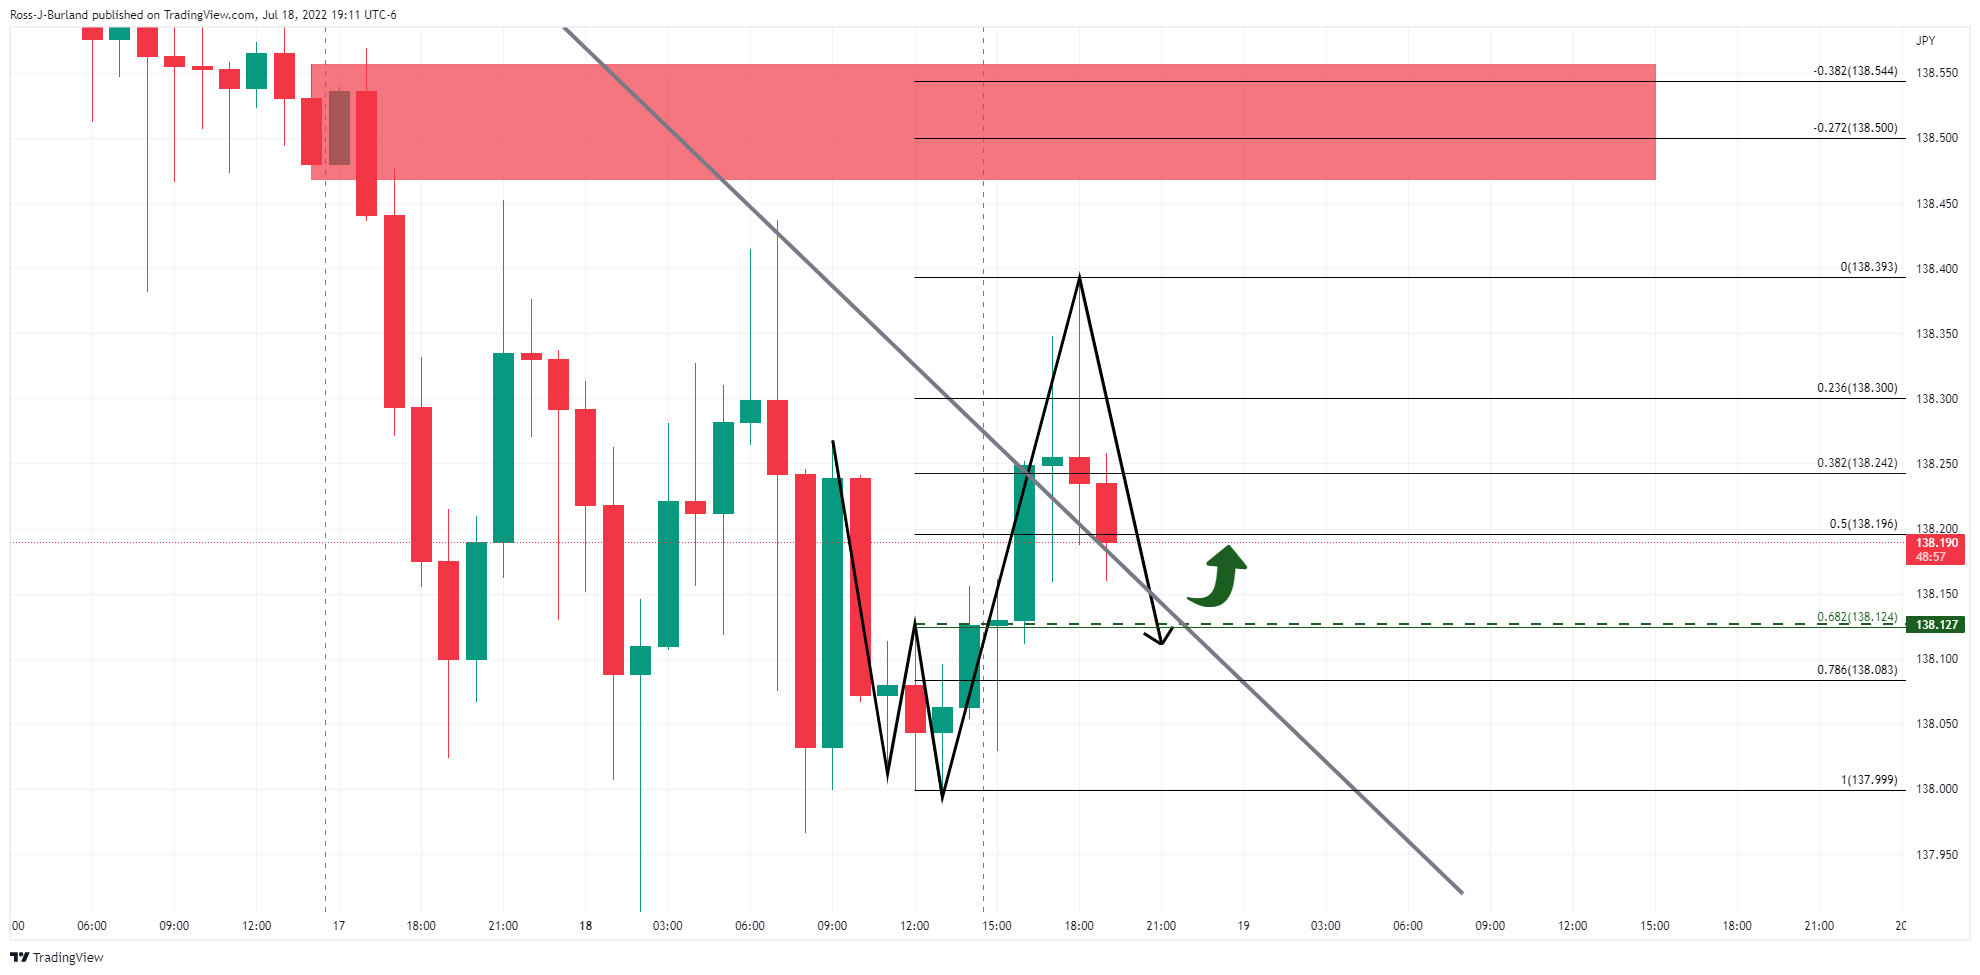
USD/JPY 5-min chart
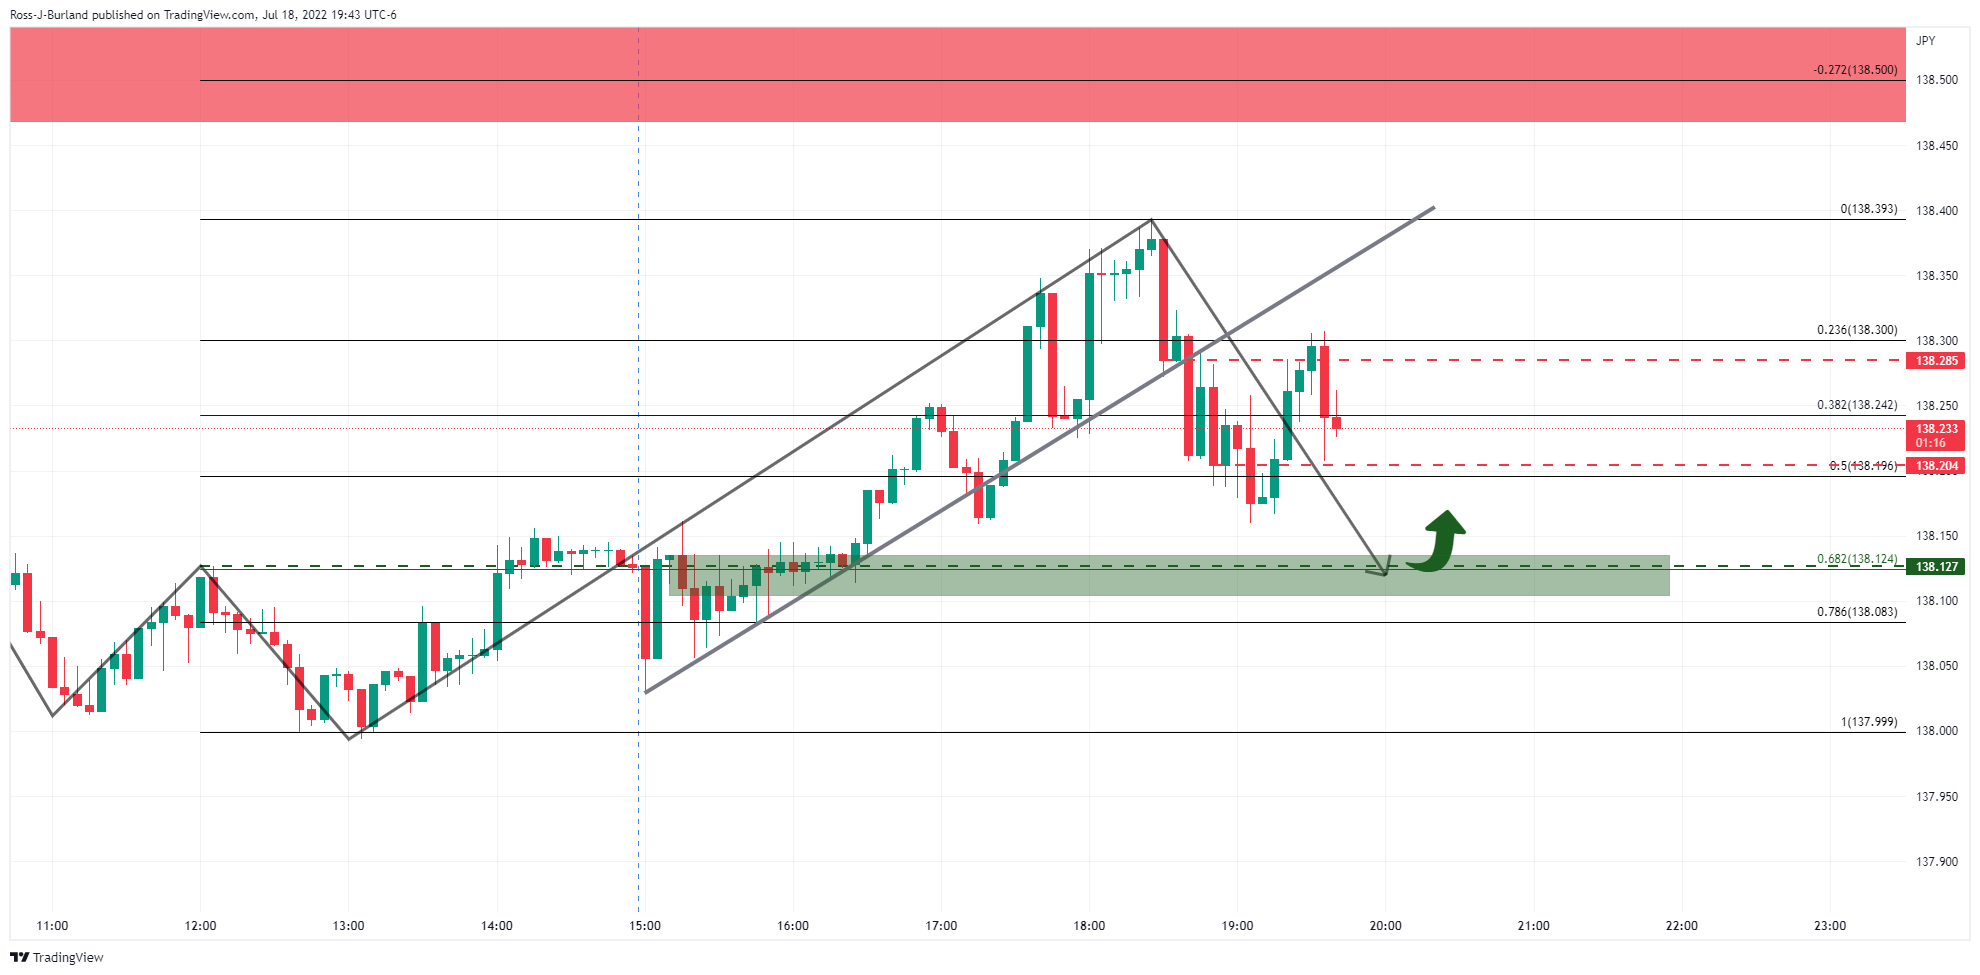
On the 5-min chart, the price has rallied into the order block area which could be the last stop before a move lower into 68.2% Fibonacci,
Author

Ross J Burland
FXStreet
Ross J Burland, born in England, UK, is a sportsman at heart. He played Rugby and Judo for his county, Kent and the South East of England Rugby team.


