USD/JPY Price Analysis: Bulls battle seven-week-old hurdle around 107.00


  • USD/JPY stays firm near the highest since July 2020.
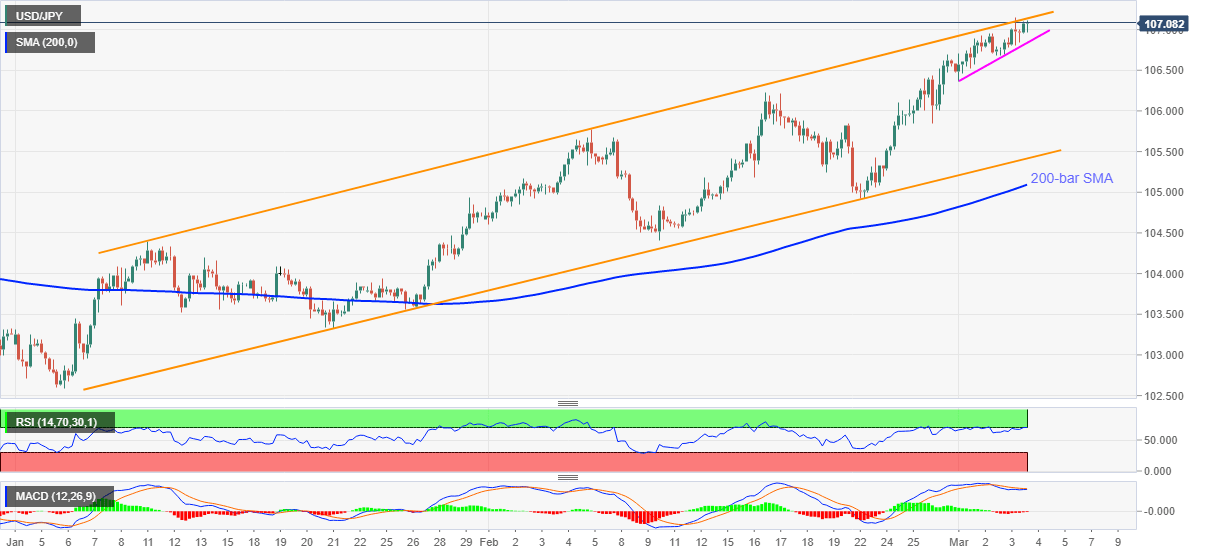
  • Overbought RSI, bearish MACD probe buyers near the upper line of an ascending trend channel.
  • Buyers aim for July top, 200-bar SMA adds to the downside filters.

USD/JPY remains positive for the second consecutive day while attacking the July 2020 peak, market the previous day, during early Thursday. However, the upper line of a rising trend channel formation since January 11 joins RSI and MACD to probe the bulls around 107.087, up 0.10% intraday.

As a result, USD/JPY sellers are waiting for a pullback move below the weekly support line, at 106.80 now, to take a risky bet while targeting the mid-February top near 106.20.

In a case where the quote drops below 106.20, February 05 high near 105.75 and the stated channel’s support line near 105.45 will be the key.

It’s worth mentioning that any further weakness past-105.45 needs to break the 200-bar SMA level of 105.09 before reversing the current uptrend.

On the flip side, the July 20 peak of 107.54 and the eight-month high near 108.15 should lure the USD/JPY buyers if they manage to cross the 107.15 immediate hurdle.

Overall, USD/JPY remains in an uptrend but a pullback can’t be ruled out.

USD/JPY four-hour chart

Trend: Pullback expected

Additional important levels

Overview
Today last price 107.08
Today Daily Change 0.10
Today Daily Change % 0.09%
Today daily open 106.98
 
Trends
Daily SMA20 105.64
Daily SMA50 104.55
Daily SMA100 104.45
Daily SMA200 105.44
 
Levels
Previous Daily High 107.16
Previous Daily Low 106.68
Previous Weekly High 106.69
Previous Weekly Low 104.92
Previous Monthly High 106.69
Previous Monthly Low 104.41
Daily Fibonacci 38.2% 106.97
Daily Fibonacci 61.8% 106.86
Daily Pivot Point S1 106.73
Daily Pivot Point S2 106.47
Daily Pivot Point S3 106.25
Daily Pivot Point R1 107.2
Daily Pivot Point R2 107.41
Daily Pivot Point R3 107.67


Share: Feed news

Information on these pages contains forward-looking statements that involve risks and uncertainties. Markets and instruments profiled on this page are for informational purposes only and should not in any way come across as a recommendation to buy or sell in these assets. You should do your own thorough research before making any investment decisions. FXStreet does not in any way guarantee that this information is free from mistakes, errors, or material misstatements. It also does not guarantee that this information is of a timely nature. Investing in Open Markets involves a great deal of risk, including the loss of all or a portion of your investment, as well as emotional distress. All risks, losses and costs associated with investing, including total loss of principal, are your responsibility. The views and opinions expressed in this article are those of the authors and do not necessarily reflect the official policy or position of FXStreet nor its advertisers. The author will not be held responsible for information that is found at the end of links posted on this page.

If not otherwise explicitly mentioned in the body of the article, at the time of writing, the author has no position in any stock mentioned in this article and no business relationship with any company mentioned. The author has not received compensation for writing this article, other than from FXStreet.

FXStreet and the author do not provide personalized recommendations. The author makes no representations as to the accuracy, completeness, or suitability of this information. FXStreet and the author will not be liable for any errors, omissions or any losses, injuries or damages arising from this information and its display or use. Errors and omissions excepted.

The author and FXStreet are not registered investment advisors and nothing in this article is intended to be investment advice.

Recommended content


Recommended content

Editors’ Picks

AUD/USD failed just ahead of the 200-day SMA

AUD/USD failed just ahead of the 200-day SMA

Finally, AUD/USD managed to break above the 0.6500 barrier on Wednesday, extending the weekly recovery, although its advance faltered just ahead of the 0.6530 region, where the key 200-day SMA sits.

AUD/USD News

EUR/USD met some decent resistance above 1.0700

EUR/USD met some decent resistance above 1.0700

EUR/USD remained unable to gather extra upside traction and surpass the 1.0700 hurdle in a convincing fashion on Wednesday, instead giving away part of the weekly gains against the backdrop of a decent bounce in the Dollar.

EUR/USD News

Gold keeps consolidating ahead of US first-tier figures

Gold keeps consolidating ahead of US first-tier figures

Gold finds it difficult to stage a rebound midweek following Monday's sharp decline but manages to hold above $2,300. The benchmark 10-year US Treasury bond yield stays in the green above 4.6% after US data, not allowing the pair to turn north.

Gold News

Bitcoin price could be primed for correction as bearish activity grows near $66K area

Bitcoin price could be primed for correction as bearish activity grows near $66K area

Bitcoin (BTC) price managed to maintain a northbound trajectory after the April 20 halving, despite bold assertions by analysts that the event would be a “sell the news” situation. However, after four days of strength, the tables could be turning as a dark cloud now hovers above BTC price.

Read more

Bank of Japan's predicament: The BOJ is trapped

Bank of Japan's predicament: The BOJ is trapped

In this special edition of TradeGATEHub Live Trading, we're joined by guest speaker Tavi @TaviCosta, who shares his insights on the Bank of Japan's current predicament, stating, 'The BOJ is Trapped.' 

Read more

Forex MAJORS

Cryptocurrencies

Signatures