|

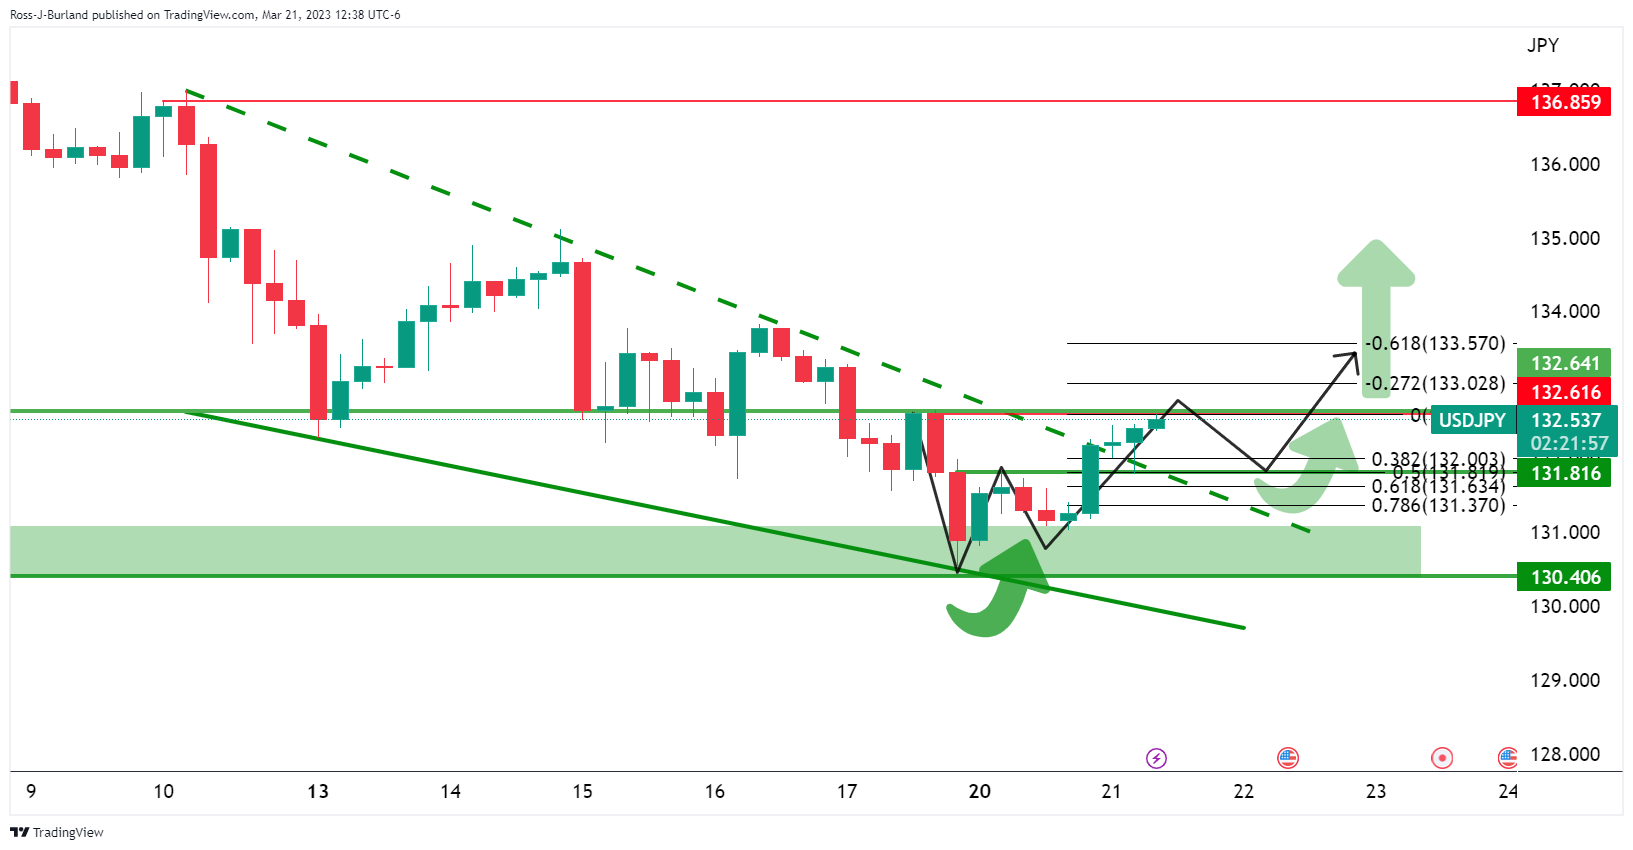
USD/JPY Price Analysis: Bulls are up to test key resistance near 132.60, 50% reversion and support eyed

  • USD/JPY is on the backside of the prior bear trend which gives a bullish bias. 
  • A 50% mean reversion comes in at 131.80 meeting the neckline structure. 

USD/JPY is up on the day by some 0.9% as the pair moves in on prior resistance near 132.60, making its way to the backside of the prior bearish trend. This leaves the outlook bullish for the days ahead. 

Meanwhile, the Federal Reserve began a two-day meeting earlier on Tuesday and the central bank is expected to raise interest rates by 25 basis points on Wednesday, or skip a chance at raising borrowing costs this month.

The following illustrates the technical outlook as per the falling wedge on the 4-hour charts and the W-formation:

USD/JPY H4 charts
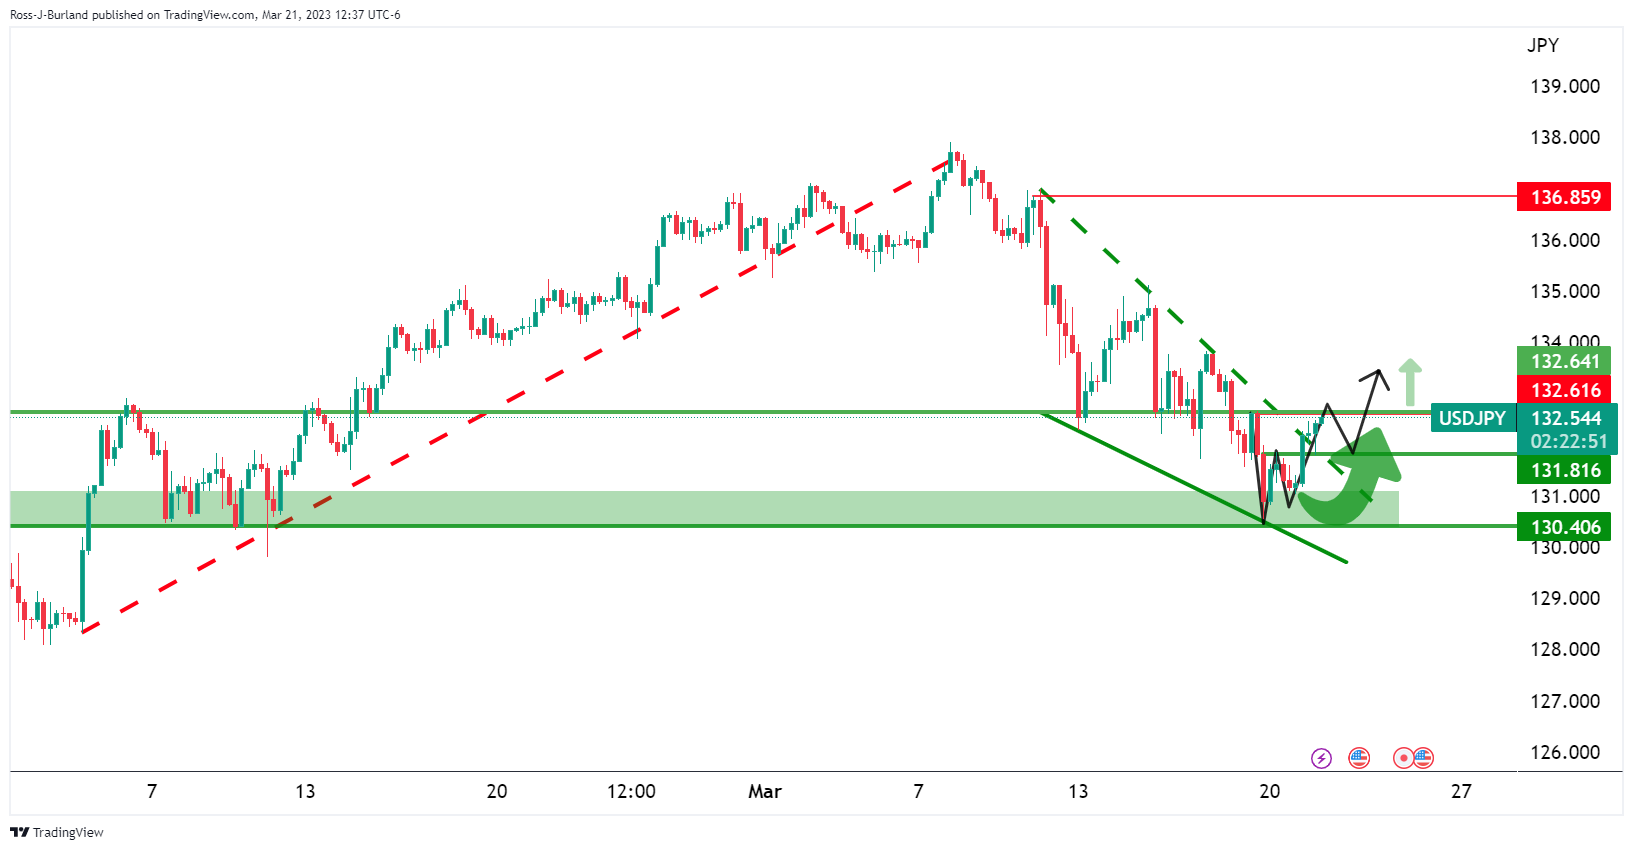
The W-formation shows the price meeting prior resistance and a restest of the neckline, which would be expected to act as support, could be the final show from the bears as bulls take control.
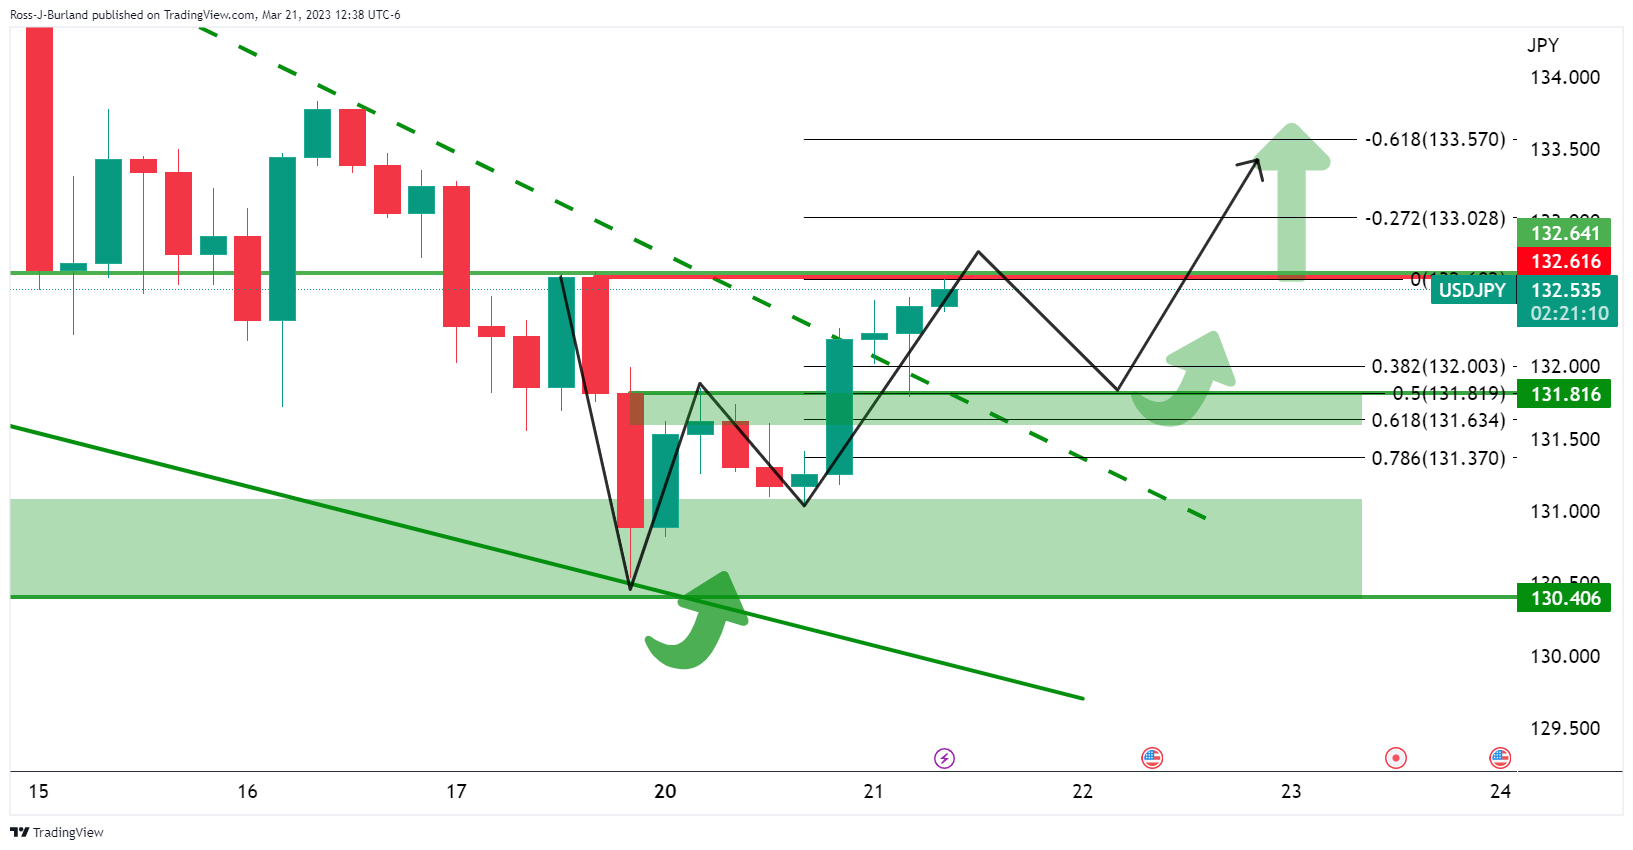
The price is on the backside of the prior bear trend and a 50% mean reversion comes in at 131.80 meeting the necklines structure. 

Author

Ross J Burland

Ross J Burland, born in England, UK, is a sportsman at heart. He played Rugby and Judo for his county, Kent and the South East of England Rugby team.


More from Ross J Burland
Share:

Editor's Picks

AUD/USD stays vulnerable below 0.6800 after weak China data

AUD/USD kicks off the week subdued, consolidating recent heavy losses to its lowest level since January. The pair stays defensive below 0.6800 after China’s October Retail Sales and Industrial Production disappointed, keeping the Chinese proxy, the Australian Dollar, undermined amid a broadly bullish US Dollar and fresh US-Iran tensions.

USD/JPY drifts toward 159.50 despite dismal Japan Q3 GDP

USD/JPY faces headwinds and drifts lower toward 159.50 at the start of the new week on Monday, shrugging off dismal data showing that Japan’s economy unexpectedly shrank by 0.1% in Q3. Japanese Yen draws support from looming intervention risks. Meanwhile, the US Dollar sits near a 19-month high amid certainty of a Fed rate hike and geopolitical risks, supporting the pair.


Gold consolidates before the next leg down

Gold enters bearish consolidation, aiming for October 2025 lows near $3,820 early Monday. US Dollar sits at 19-month highs amid fresh Iranian aggression and hawkish Fedspeak. Gold’s daily technical setup suggests a ‘sell-the-bounce’ strategy for traders.

Bitcoin, Ethereum and Ripple remain locked in a bearish trend despite oversold signals

Bitcoin (BTC), Ethereum (ETH), and Ripple (XRP) remain under pressure after losses of over 12%, 13%, and 12%, respectively, last week. The top three cryptocurrencies struggle to find a floor, with BTC trading below $65,000, while ETH and XRP extend their declines on Monday.

US Dollar Weekly Forecast: The Fed's inflation nightmare is the Dollar's best friend

The US Dollar’s rally appears anything but abated so far. Indeed, the Greenback advanced to levels last visited in April 2025, well past the 103.00 barrier when gauged by the US Dollar Index.

Gold hit its lowest level of 2026 near $3,850
Gold (XAU/USD) attempts to stabilize around $3,890 on Friday after falling to $3,852 on Thursday, its lowest level since October 2025. The precious metal has lost more than 4% this week, as investors increasingly anticipate further monetary tightening from the Federal Reserve (Fed). The latest decline reflects a sharp change in market expectations.