|

USD/JPY Price Analysis: Bullish momentum remains as a falling wedge forms

  • The USD/JPY 1-hour chart portrays the formation of a bullish continuation chart pattern, keeping bulls hopeful of higher prices.
  • USD/JPY Price Analysis: Long-term is still downward biased unless it breaks resistance around 133.00.

The USD/JPY erases Wednesday’s gains and aims toward the lows of the 130.30-132.90 range during the North American session, eyeing a break below the 20-day Exponential Moving Average (EMA) at 130.66. At the time of writing, the USD/JPY exchanges hands at 131.11, below its opening price by 0.18%.

From a daily chart perspective, the USD/JPY remains downward biased, though it has been tracking the 20-day EMA during the last three days, unable to breach the 130.00 mark. Oscillators like the Relative Strength Index (RSI) and the Rate of Change (RoC) suggest a bearish continuation. But the Bank of Japan’s (BoJ) dovish stance kept market participants from committing to short positions.

In the near term, the USD/JPY one-hour chart portrays the formation of a falling wedge, suggesting a bullish continuation, which could lift prices towards 131.60 and the January 11 high at 132.87. Albeit the Relative Strength Index (RSI) aims upward, it remains in bearish territory, with its slope shifting flat, but the Rate of Change (RoC) depicts buyers gathering momentum. Hence, mixed signals suggest caution is warranted.

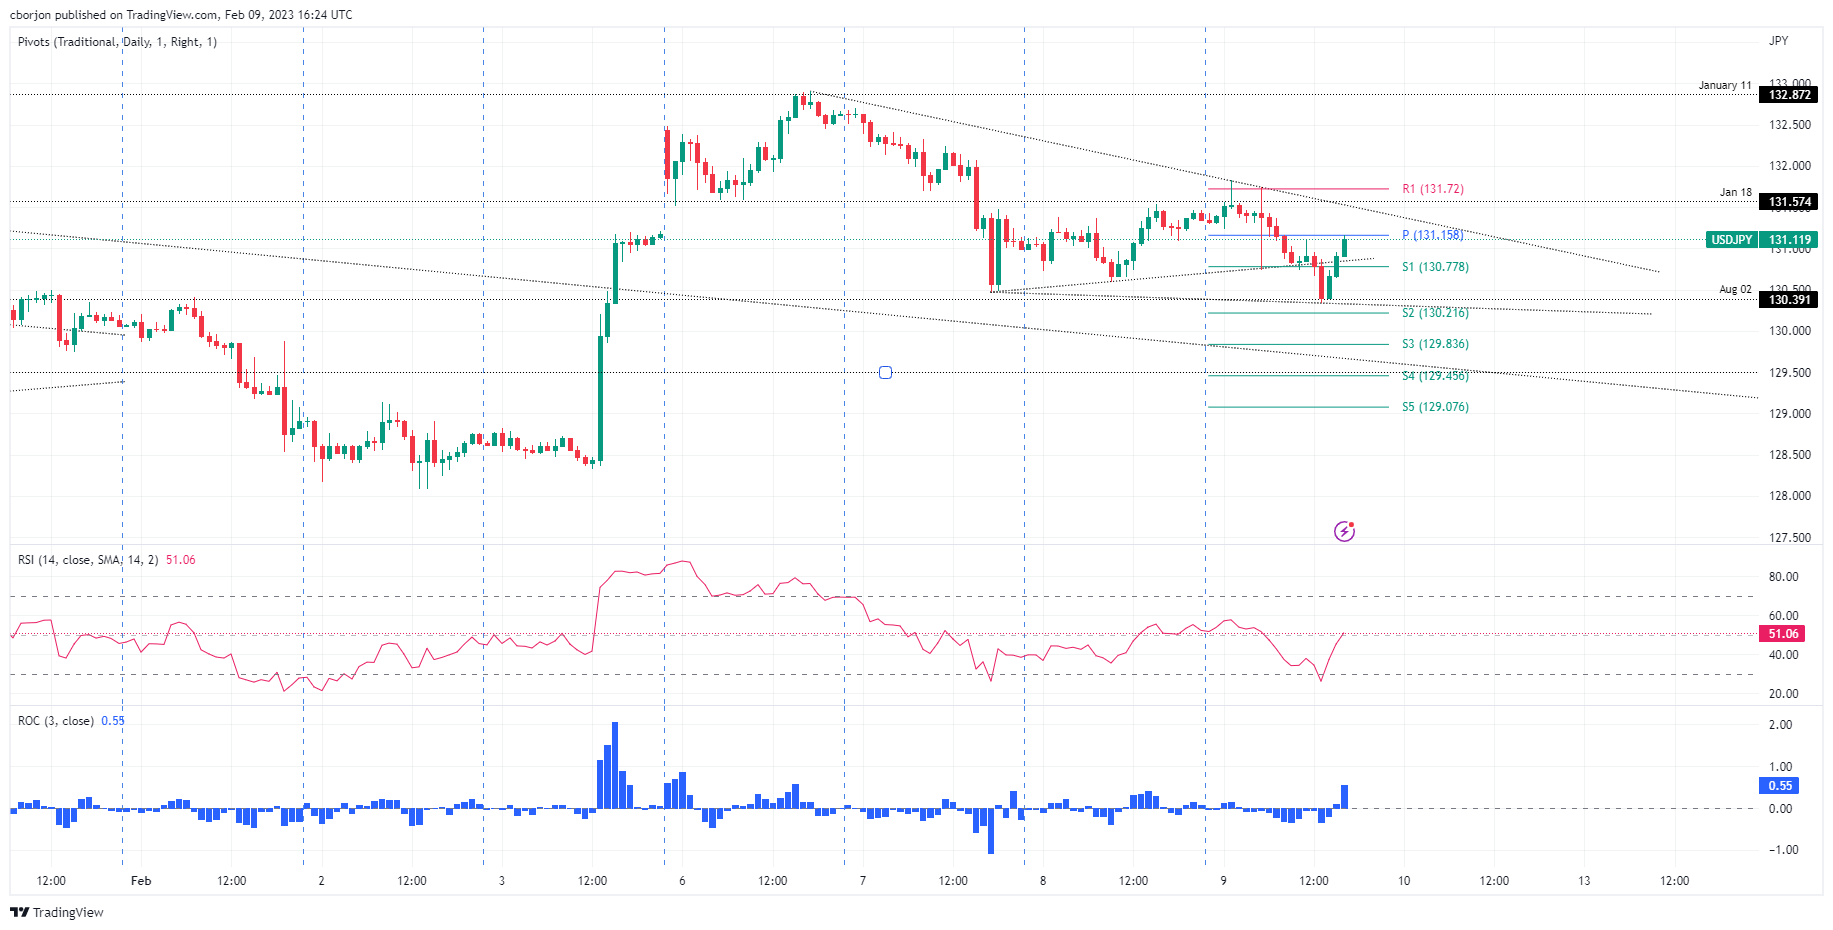
USD/JPY buyers need to reclaim 131.82, Thursday’s high. Once done, that would pave the way towards 132.00, 132.87, and the psychological 133.00 barrier. As an alternate scenario, the bearish continuation would resume if the falling wedge breaks downwards. Therefore, the USD/JPY first support would be 130.34, February 9 low. The break below will expose the S2 and S3 daily pivot points, each at 130.21 and 129.83.

USD/JPY One-hour chart

USD/JPY key technical levels

USD/JPY

Overview
Today last price131
Today Daily Change-0.44
Today Daily Change %-0.33
Today daily open131.44
 
Trends
Daily SMA20129.79
Daily SMA50132.4
Daily SMA100138.43
Daily SMA200136.82
 
Levels
Previous Daily High131.54
Previous Daily Low130.6
Previous Weekly High131.2
Previous Weekly Low128.08
Previous Monthly High134.78
Previous Monthly Low127.22
Daily Fibonacci 38.2%131.18
Daily Fibonacci 61.8%130.96
Daily Pivot Point S1130.84
Daily Pivot Point S2130.25
Daily Pivot Point S3129.9
Daily Pivot Point R1131.79
Daily Pivot Point R2132.14
Daily Pivot Point R3132.73

Author

Christian Borjon Valencia

Christian Borjon began his career as a retail trader in 2010, mainly focused on technical analysis and strategies around it. He started as a swing trader, as he used to work in another industry unrelated to the financial markets.

More from Christian Borjon Valencia
Share:

Markets move fast. We move first.

Orange Juice Newsletter brings you expert driven insights - not headlines. Every day on your inbox.

By subscribing you agree to our Terms and conditions.

Editor's Picks

EUR/USD rebounds after falling toward 1.1700

EUR/USD gains traction and trades above 1.1730 in the American session, looking to end the week virtually unchanged. The bullish opening in Wall Street makes it difficult for the US Dollar to preserve its recovery momentum and helps the pair rebound heading into the weekend.

GBP/USD steadies below 1.3400 as traders assess BoE policy outlook

Following Thursday's volatile session, GBP/USD moves sideways below 1.3400 on Friday. Investors reassess the Bank of England's policy oıtlook after the MPC decided to cut the interest rate by 25 bps by a slim margin. Meanwhile, the improving risk mood helps the pair hold its ground.

Gold stays below $4,350, looks to post small weekly gains

Gold struggles to gather recovery momentum and stays below $4,350 in the second half of the day on Friday, as the benchmark 10-year US Treasury bond yield edges higher. Nevertheless, the precious metal remains on track to end the week with modest gains as markets gear up for the holiday season.

Crypto Today: Bitcoin, Ethereum, XRP rebound amid bearish market conditions

Bitcoin (BTC) is edging higher, trading above $88,000 at the time of writing on Monday. Altcoins, including Ethereum (ETH) and Ripple (XRP), are following in BTC’s footsteps, experiencing relief rebounds following a volatile week.

How much can one month of soft inflation change the Fed’s mind?

One month of softer inflation data is rarely enough to shift Federal Reserve policy on its own, but in a market highly sensitive to every data point, even a single reading can reshape expectations. November’s inflation report offered a welcome sign of cooling price pressures. 

XRP rebounds amid ETF inflows and declining retail demand demand

XRP rebounds as bulls target a short-term breakout above $2.00 on Friday. XRP ETFs record the highest inflow since December 8, signaling growing institutional appetite.