USD/JPY Price Analysis: Bounces off multi-week low, remains vulnerable below 61.8% Fibo.
- USD/JPY continues losing ground for the third straight day and drops to a fresh multi-week low.
- A combination of factors strengthens the safe-haven JPY and exerts heavy pressure on the major.
- A strong pickup in the USD demand lends some support and helps limit losses, for the time being.
- The technical setup favours bearish traders and supports prospects for a further depreciating move.

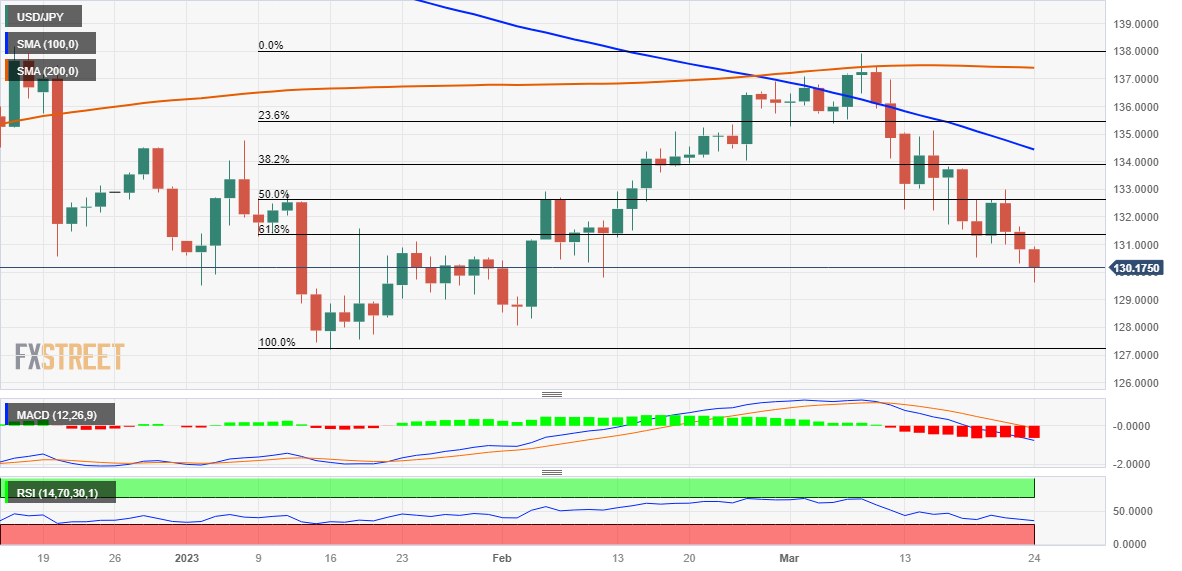
The USD/JPY pair remains under heavy selling pressure for the third successive day and touches its lowest level since February 03, around the 129.65 region on Friday. Spot prices, however, trim a part of the intraday losses and trade just above the 130.00 psychological mark during the early North American session, still down nearly 0.50% for the day.
The Japanese Yen (JPY) draws support from data showing that an important gauge of Japan’s consumer prices rose at its fastest pace since 1982 in February. Apart from this, a fresh wave of the global risk-aversion trade, amid lingering concerns about a full-blown banking crisis and looming recession risks, provides an additional boost to the safe-haven JPY and drags the USD/JPY pair lower.
Furthermore, the narrowing of the US-Japan rate differential, led by the ongoing steep decline in the US Treasury bond yields in the wake of the Federal Reserve's hints of a pause to interest rate hikes, is seen driving flows towards the JPY. That said, a strong broad-based US Dollar (USD) rally lends some support to the USD/JPY pair and helps limit any further losses, at least for the time being.
From a technical perspective, the overnight sustained break and acceptance below the 61.8% Fibonacci retracement level of the January-March rally could be seen as a fresh trigger for bearish traders. Moreover, oscillators on the daily chart are holding deep in the negative territory and are still far from being in the oversold zone, which, in turn, supports prospects for a further depreciating move.
Hence, any further recovery move is more likely to attract fresh sellers around the 131.00 round-figure mark. This should cap the USD/JPY pair near the 131.30 region, or the 61.8% Fibo. level. That said, some follow-through buying could trigger a short-covering move and lift spot prices to the 132.00 mark. The momentum could get extended towards the 132.50 area, or the 50% Fibo. level.
On the flip side, the daily swing low, around the 129.65 region, now seems to protect the immediate downside, below which the USD/JPY pair could fall to the 129.00 mark. The next relevant support is pegged near the 128.55-128.50 zone, below which spot prices could slide towards the 128.00 round figure and aim to challenge the YTD low, around the 127.20 region touched in January.
USD/JPY daily chart
Key levels to watch
Author

Haresh Menghani
FXStreet
Haresh Menghani is a detail-oriented professional with 10+ years of extensive experience in analysing the global financial markets.

















