|

USD/JPY Price Analysis: Bounces off a three-month low, eyeing 139.00

  • USD/JPY tumbled to a fresh three-month-low but rebounded towards 138.70s.
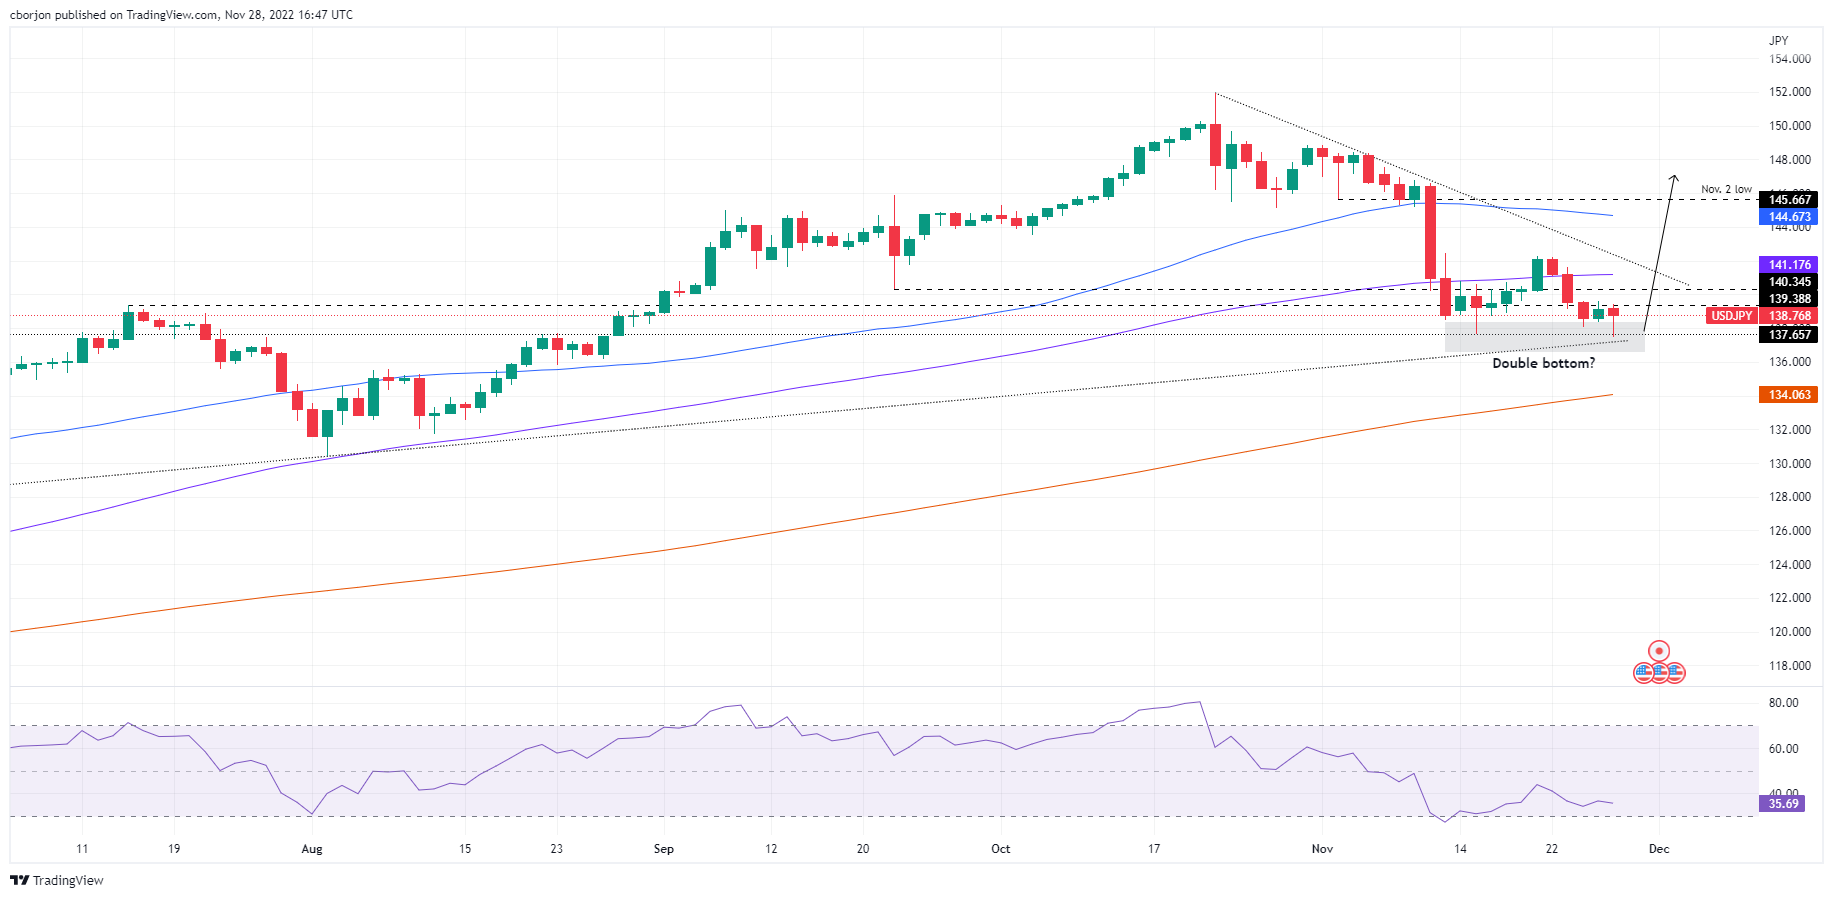
  • A double bottom in the USD/JPY daily chart targets a rise to 145.00.
  • USD/JPY Price Analysis: Break above 139.00 will exacerbate a rally to 140.00.

The USD/JPY is falling in the North American session, comfortable below the 139.00 figure after hitting a daily low of 137.49, reaching a fresh three-month low on a soft US Dollar (USD). At the time of writing,  the USD/JPY is trading at 138.80, below its opening price by 0.25%.

USD/JPY Price Analysis: Technical outlook

After testing during the last month, the 137.00 mark, the USD/JPY rebounded strongly, reclaiming the 138.00 figure, signaling that buyers stepped in. A possible formation of a “double bottom” chart pattern around 137.50/60 could open the door for a recovery, which could target the 50-day Exponential Moving Average (EMA) at 144.67, as the initial target, on its way to 147.00. Notably, the Relative Strength Index (RSI) remained unchanged as the USD/JPY price action dived toward a multi-month low. Hence, a positive divergence between RSI and price action could pave the way for further USD/JPY upside.

If that scenario continues, the USD/JPY first resistance would be the 140.00 mark. The break above will expose the 100-day EMA at 141.17, followed by the 142.00 figure, and the 50-day EMA at 144.67. In an alternate scenario, the USD/JPY first support would be 138.00. Once cleared, the next support would be the multi-month low around 137.49, ahead of an upslope trendline around 137.00.

USD/JPY Key Technical Levels

USD/JPY

Overview
Today last price138.77
Today Daily Change-0.27
Today Daily Change %-0.19
Today daily open139.04
 
Trends
Daily SMA20142.87
Daily SMA50144.76
Daily SMA100141.17
Daily SMA200133.96
 
Levels
Previous Daily High139.6
Previous Daily Low138.37
Previous Weekly High142.25
Previous Weekly Low138.05
Previous Monthly High151.94
Previous Monthly Low143.53
Daily Fibonacci 38.2%139.13
Daily Fibonacci 61.8%138.84
Daily Pivot Point S1138.41
Daily Pivot Point S2137.78
Daily Pivot Point S3137.19
Daily Pivot Point R1139.63
Daily Pivot Point R2140.22
Daily Pivot Point R3140.85

Author

Christian Borjon Valencia

Markets analyst, news editor, and trading instructor with over 14 years of experience across FX, commodities, US equity indices, and global macro markets.

More from Christian Borjon Valencia
Share:

Editor's Picks

EUR/USD holds above 1.1750 after mixed EU PMI data

EUR/USD manages to hold above 1.1750 but struggles to gather recovery momentum on Friday, following the mixed February PMI figures from Germany and the Eurozone. In the second half of the day, Q4 GDP, December inflation and February PMI data from the US will be watched closely by market participants.

GBP/USD recovers further toward 1.3500 after UK PMI data

GBP/USD is recovering ground further toward 1.3500 in European trading on Friday, helped by a modest uptick in the Pound Sterling after stronger-than-expected UK January Retail Sales and February PMI data. However, the pair's further upside could be limited amid persistent US Dollar strength as the focus turns to key US data. 

Gold sticks to positive bias above $5,000 ahead of US data

Gold gains some positive traction for the third consecutive day on Friday. holding above $5,000. Traders now look forward to the key US macro releases – the Advance Q4 GDP report and the Personal Consumption Expenditures (PCE) Price Index – for fresh trading impetus. 

US GDP growth expected to slow down significantly in Q4 after stellar Q3 

The United States Bureau of Economic Analysis will publish the first preliminary estimate of the fourth-quarter Gross Domestic Product at 13:30 GMT. Analysts forecast the US economy to have expanded at a 3% annualized rate, slowing down from the 4.4% growth posted in the previous quarter.

Iran tensions and AI fears at the forefront ahead of key US data

Thursday’s scorecard shows major US Stock benchmarks closed modestly in the red amid mounting US-Iran tensions and AI disruption worries. The S&P 500 shed 19 points (0.3%) to 6,861, the Nasdaq 100 lost 101 points (0.4%) to 24,797, and the Dow Jones Industrial Average dropped 267 points (0.5%) to 49,395.

Official Trump price approaches breakout with mixed signals from traders

Official Trump (TRUMP) is trading at $3.50 at the time of writing, approaching its upper consolidation range. A breakout from this range could open the door for an upside move. On-chain data shows market indecision, with balanced flows between bulls and bears, signaling a lack of clear directional bias.