USD/JPY Price Analysis: Bears poke 10-week-old support line near 130.50


  • USD/JPY prints three-day losing streak to refresh multi-day low, bounces off daily low at the latest.
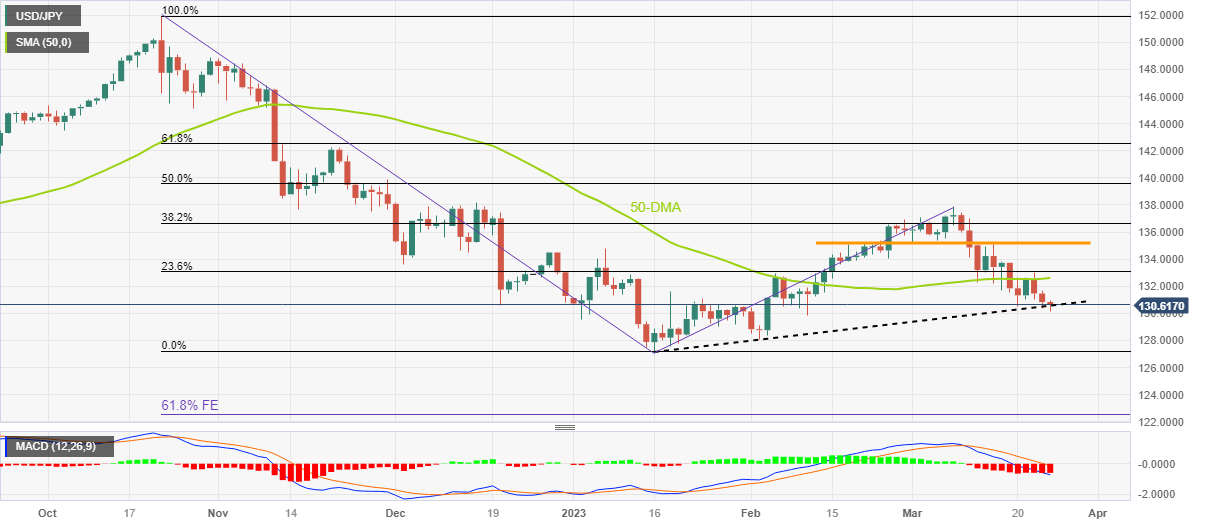
  • Sustained trading below 50-DMA, bearish MACD signals favor sellers.
  • Yen pair’s recovery remains elusive below five-week-long horizontal resistance.

USD/JPY licks its wounds near 130.60, after refreshing a 1.5-month low, during a three-day downtrend on early Friday. In doing so, the Yen pair sellers attack the support line stretched from early January while extending the mid-week pullback from the 50-DMA.

In addition to the pair’s inability to cross the 50-DMA, around 132.60 by the press time, the bearish MACD signals also weigh on the quote and suggest the downside break of the immediate support line, close to 130.50 at the latest.

Following that, the 130.00 round figure and multiple levels marked in February near 129.30, as well as near 128.00, could test the USD/JPY bears before directing them to the yearly low of 127.21.

It’s worth noting, however, that the Yen pair’s sustained weakness past 127.21, could make it vulnerable to testing the 61.8% Fibonacci Expansion (FE) of its moves between October 2022 and March 2023, near 122.50.

Alternatively, USD/JPY recovery can initially aim for the 50-DMA hurdle of 132.60. However, a horizontal area comprising multiple tops marked since February 17, close to 135.20, appears a tough nut to crack for the bulls afterward.

In a case where the Yen pair remains firmer past 135.20, the odds of witnessing a fresh monthly high, currently around 137.90, can’t be ruled out.

USD/JPY: Daily chart

Trend: Further downside expected

Additional important levels

Overview
Today last price 130.59
Today Daily Change -0.24
Today Daily Change % -0.18%
Today daily open 130.83
 
Trends
Daily SMA20 134.57
Daily SMA50 132.55
Daily SMA100 134.61
Daily SMA200 137.43
 
Levels
Previous Daily High 131.66
Previous Daily Low 130.32
Previous Weekly High 135.12
Previous Weekly Low 131.56
Previous Monthly High 136.92
Previous Monthly Low 128.08
Daily Fibonacci 38.2% 130.83
Daily Fibonacci 61.8% 131.15
Daily Pivot Point S1 130.21
Daily Pivot Point S2 129.6
Daily Pivot Point S3 128.87
Daily Pivot Point R1 131.55
Daily Pivot Point R2 132.28
Daily Pivot Point R3 132.89


Share: Feed news

Information on these pages contains forward-looking statements that involve risks and uncertainties. Markets and instruments profiled on this page are for informational purposes only and should not in any way come across as a recommendation to buy or sell in these assets. You should do your own thorough research before making any investment decisions. FXStreet does not in any way guarantee that this information is free from mistakes, errors, or material misstatements. It also does not guarantee that this information is of a timely nature. Investing in Open Markets involves a great deal of risk, including the loss of all or a portion of your investment, as well as emotional distress. All risks, losses and costs associated with investing, including total loss of principal, are your responsibility. The views and opinions expressed in this article are those of the authors and do not necessarily reflect the official policy or position of FXStreet nor its advertisers. The author will not be held responsible for information that is found at the end of links posted on this page.

If not otherwise explicitly mentioned in the body of the article, at the time of writing, the author has no position in any stock mentioned in this article and no business relationship with any company mentioned. The author has not received compensation for writing this article, other than from FXStreet.

FXStreet and the author do not provide personalized recommendations. The author makes no representations as to the accuracy, completeness, or suitability of this information. FXStreet and the author will not be liable for any errors, omissions or any losses, injuries or damages arising from this information and its display or use. Errors and omissions excepted.

The author and FXStreet are not registered investment advisors and nothing in this article is intended to be investment advice.

Recommended content


Recommended content

Editors’ Picks

EUR/USD clings to daily gains above 1.0650

EUR/USD clings to daily gains above 1.0650

EUR/USD gained traction and turned positive on the day above 1.0650. The improvement seen in risk mood following the earlier flight to safety weighs on the US Dollar ahead of the weekend and helps the pair push higher.

EUR/USD News

GBP/USD recovers toward 1.2450 after UK Retail Sales data

GBP/USD recovers toward 1.2450 after UK Retail Sales data

GBP/USD reversed its direction and advanced to the 1.2450 area after touching a fresh multi-month low below 1.2400 in the Asian session. The positive shift seen in risk mood on easing fears over a deepening Iran-Israel conflict supports the pair.

GBP/USD News

Gold holds steady at around $2,380 following earlier spike

Gold holds steady at around $2,380 following earlier spike

Gold stabilized near $2,380 after spiking above $2,400 with the immediate reaction to reports of Israel striking Iran. Meanwhile, the pullback seen in the US Treasury bond yields helps XAU/USD hold its ground.

Gold News

Bitcoin Weekly Forecast: BTC post-halving rally could be partially priced in Premium

Bitcoin Weekly Forecast: BTC post-halving rally could be partially priced in

Bitcoin price shows no signs of directional bias while it holds above  $60,000. The fourth BTC halving is partially priced in, according to Deutsche Bank’s research. 

Read more

Week ahead – US GDP and BoJ decision on top of next week’s agenda

Week ahead – US GDP and BoJ decision on top of next week’s agenda

US GDP, core PCE and PMIs the next tests for the Dollar. Investors await BoJ for guidance about next rate hike. EU and UK PMIs, as well as Australian CPIs also on tap.

Read more

Forex MAJORS

Cryptocurrencies

Signatures