|

USD/JPY Price Analysis: Bears charge helped by intervention rumors, eye 152.00

  • USD/JPY drops 0.49%, extending a downtrend possibly sparked by earlier BoJ intervention.
  • Bearish harami pattern observed; recovery contingent on breaking 153.00 resistance.
  • Key support at 152.00; further declines may target April's low of 150.81.

The USD/JPY dropped for the third straight day and accumulated losses of more than 3.40% in the week after a suspected intervention by the Bank of Japan (BoJ) on Monday. Since then, the pair formed a two-candlestick chart pattern, a ‘bearish harami’ which reassembles an inside day, confirmed by Wednesday’s price action. That said, on Friday, the pair fell 0.49% and traded at 152.93.

USD/JPY Price Analysis: Technical outlook

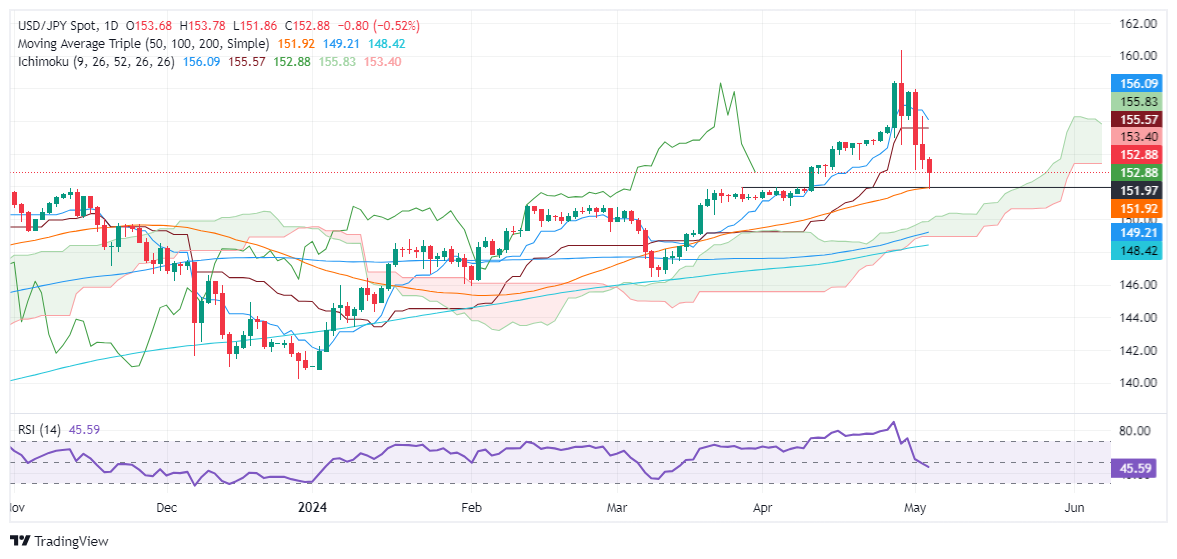
Despite retreating sharply during the week, the USD/JPY is still upward biased, as shown by the daily chart. The pair registered a daily low at the confluence of October 21, 2022, low and the 50-day moving average at around 151.87/92, but buyers lifted the pair toward current exchange rates.

If buyers push prices above 153.00 and achieve a daily close above the latter, that could pave the way for further gains. The first resistance would be the Senkou Span B at 153.35, followed by the 154.00 figure. Further gains are seen once those levels are surpassed, with the next resistance seen at the confluence of the Senkou Span A and the Kijun-Sen at 155.78.

On the other hand, the first support would be the 152.00 mark, followed by the previously mentioned confluence of the 50-DMA and October’s 2022 high at 151.92/87. A breach of that level would cause the pair to dive toward April’s 5 low at 150.81.

USD/JPY Price Action – Daily Chart

USD/JPY

Overview
Today last price152.93
Today Daily Change-0.75
Today Daily Change %-0.49
Today daily open153.68
 
Trends
Daily SMA20154.45
Daily SMA50151.88
Daily SMA100149.1
Daily SMA200148.36
 
Levels
Previous Daily High156.28
Previous Daily Low153.06
Previous Weekly High158.44
Previous Weekly Low154.46
Previous Monthly High160.32
Previous Monthly Low150.81
Daily Fibonacci 38.2%154.29
Daily Fibonacci 61.8%155.05
Daily Pivot Point S1152.4
Daily Pivot Point S2151.12
Daily Pivot Point S3149.17
Daily Pivot Point R1155.62
Daily Pivot Point R2157.57
Daily Pivot Point R3158.85

Author

Christian Borjon Valencia

Christian Borjon began his career as a retail trader in 2010, mainly focused on technical analysis and strategies around it. He started as a swing trader, as he used to work in another industry unrelated to the financial markets.

More from Christian Borjon Valencia
Share:

Markets move fast. We move first.

Orange Juice Newsletter brings you expert driven insights - not headlines. Every day on your inbox.

By subscribing you agree to our Terms and conditions.

Editor's Picks

EUR/USD eases toward 1.1700 as USD recovers

EUR/USD stays on the back foot and declines toward 1.1700 on Friday. The pair faces headwinds from a renewed uptick in the US Dollar as investors look past softer US inflation data. However, the EUR/USD downside appears capped by expectations of the Fed-ECB monetary policy divergence. 

GBP/USD steadies below 1.3400 as traders digest BoE policy update and US inflation data

The GBP/USD pair stalls the previous day's pullback from the vicinity of mid-1.3400s and a nearly two-month high, though it struggles to attract meaningful buyers during the Asian session on Friday. Spot prices currently trade around the 1.3380-1.3385 region, up only 0.05% for the day, amid mixed cues.

Gold stays weak below $4,350 as USD bulls shrug off softer US CPI

Gold holds the previous day's late pullback from the vicinity of the record high and stays in the red below $4,350 in the European session on Friday. The US CPI report released on Thursday pointed to cooling inflationary pressures, but the US Dollar seems resilient amid a fresh bout of short-covering.

Bitcoin, Ethereum and Ripple correction slide as BoJ rate decision weighs on sentiment

Bitcoin, Ethereum, and Ripple are extending their correction phases after losing nearly 3%, 8%, and 10%, respectively, through Friday. The pullback phase is further strengthened as the upcoming Bank of Japan’s rate decision on Friday weighs on risk sentiment, with BTC breaking key support, ETH deepening weekly losses, and XRP sliding to multi-month lows.

How much can one month of soft inflation change the Fed’s mind?

One month of softer inflation data is rarely enough to shift Federal Reserve policy on its own, but in a market highly sensitive to every data point, even a single reading can reshape expectations. November’s inflation report offered a welcome sign of cooling price pressures. 

Ethereum Price Forecast: EF outlines ways to solve growing state issues

Ethereum price today: $2,920. The EF noted that Ethereum's growing state could lead to centralization and weaken censorship resistance. The Stateless Consensus team outlined state expiry, state archive and partial statelessness as potential solutions to the growing state load.