|

USD/JPY Price Analysis: 200-SMA, immediate support line defend bulls

  • USD/JPY steps back from intraday top while marking indecisiveness on a third consecutive day off in Japan.
  • Normal RSI conditions keep buyers hopeful unless breaking immediate key supports.
  • Monthly horizontal area becomes a crucial hurdle to the north.

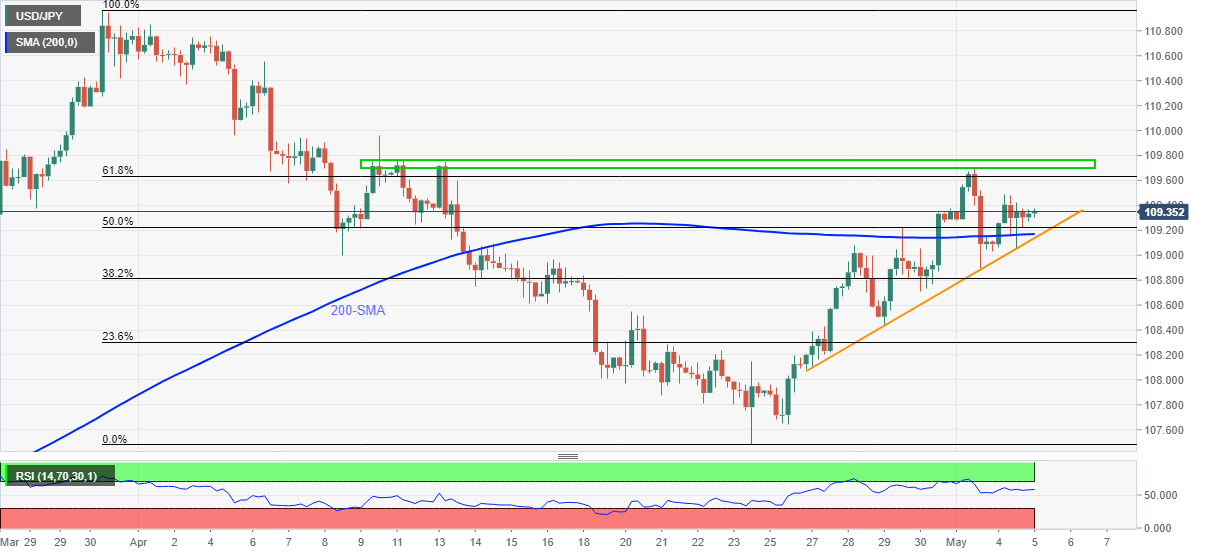
USD/JPY eases to 109.35, revisiting the day’s opening levels, amid early Wednesday. Even so, the yen pair remains above 200-SMA and an ascending support line from April 26 to keep the buyers hopeful amid a quiet session in Asia, mainly due to holidays in China and Japan.

The RSI line’s steady moves above 50.00 also back the USD/JPY bulls targeting 109.50 nearby resistance.

Though, 61.8% Fibonacci retracement of March-April downside and a horizontal area comprising multiple tops marked since early April, respectively around 109.60 and 109.70-75, will be tough nuts to crack for the pair before confirming further upside.

Meanwhile, a 50% Fibonacci retracement level of 109.22 can restrict further declines ahead of highlighting the 109.17-13 support zone that includes the stated SMA and rising trend line.

Overall, USD/JPY remains lackluster but well in the vicinity of buyer’s catch.

USD/JPY four-hour chart

Trend: Further upside expected

Additional important levels

Overview
Today last price109.33
Today Daily Change-0.02
Today Daily Change %-0.02%
Today daily open109.35
 
Trends
Daily SMA20108.8
Daily SMA50108.73
Daily SMA100106.45
Daily SMA200105.82
 
Levels
Previous Daily High109.49
Previous Daily Low109.03
Previous Weekly High109.37
Previous Weekly Low107.64
Previous Monthly High110.85
Previous Monthly Low107.48
Daily Fibonacci 38.2%109.31
Daily Fibonacci 61.8%109.21
Daily Pivot Point S1109.09
Daily Pivot Point S2108.83
Daily Pivot Point S3108.63
Daily Pivot Point R1109.55
Daily Pivot Point R2109.75
Daily Pivot Point R3110.01

Author

Anil Panchal

Anil Panchal

FXStreet

Anil Panchal has nearly 15 years of experience in tracking financial markets. With a keen interest in macroeconomics, Anil aptly tracks global news/updates and stays well-informed about the global financial moves and their implications.

More from Anil Panchal
Share:

Editor's Picks

AUD/USD eyes 0.7150 barrier nine-day EMA

AUD/USD inches higher after registering modest losses in the previous day, trading around 0.7130 during the Asian hours. The technical analysis of the daily chart indicates that the pair is moving sideways within the rectangle pattern, suggesting a consolidation as neither the bulls nor the bears have enough momentum to take control of the market.

USD/JPY trades below 160.00 intervention threshold; bullish bias intact

The USD/JPY pair attracts some sellers during the Asian session amid fears that authorities will step in again to prop up the Japanese Yen. Furthermore, the Israel-Lebanon truce prompts some profit-taking around the US Dollar and exerts downward pressure on the currency pair.

Gold extends rebound to $4,500 as US yields edge lower

Gold (XAU/USD) preserves its recovery momentum following Wednesday's slide and tests the $4,500 mark in the second half of the day on Thursday. While US-Iran uncertainty remains, easing tensions between Lebanon on Israel seems to be helping the market mood improve, causing the USD to lose strength alongside falling US T-bond yields and opening the door for a decisive rebound in XAU/USD.

Bitcoin’s massive storm is back: Why the sell-off is far from over

Bitcoin price action over the last few weeks has felt less like a normal, healthy correction and more like a slow grinding crash that continues to wreak havoc on holdings and trading accounts. And everything suggests that the dramatic crash isn’t over.

Nonfarm payrolls: Testing the limits of Fed policy patience

The upcoming nonfarm payrolls report for May will provide the final update on the US labor market before Kevin Warsh attends his first policy meeting as the new Fed Chair later this month.

Recession on paper: What really moves the Canadian Loonie now?

Statistics Canada handed the headline writers a gift and the analysts a headache. Real GDP shrank 0.1% on an annualized basis in the first quarter, and with the fourth quarter of 2025 revised down to a 1.0% contraction, that is two negative quarters in a row, the textbook definition of a technical recession and Canada's first since the pandemic.