USD/JPY Price Analysis: 200-HMA prods bulls around mid-131.00s


  • USD/JPY bulls take a breather after rising nearly 80-pips on key resistance break.
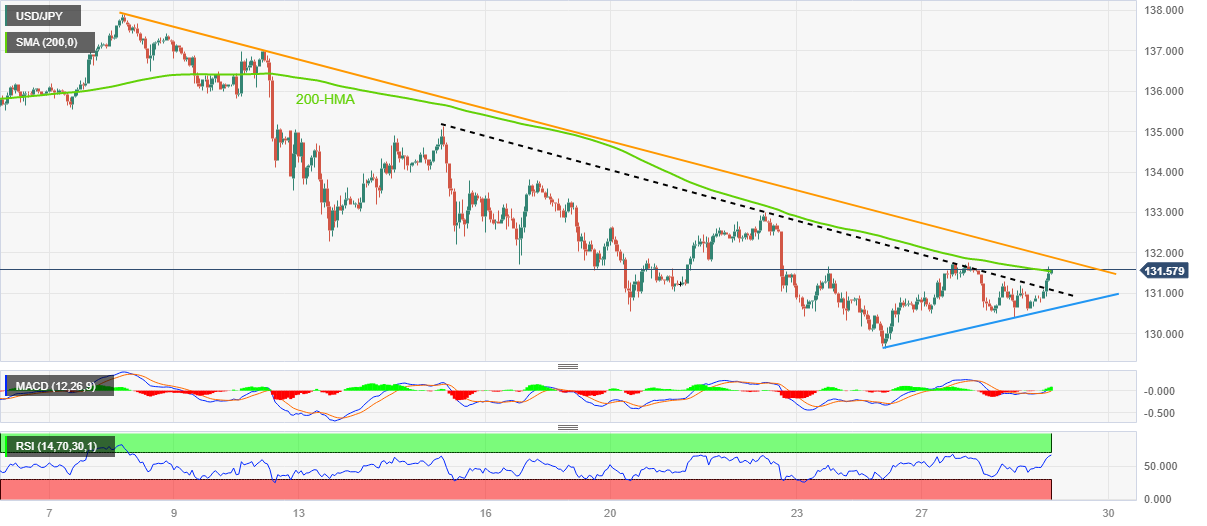
  • Nearly Overbought RSI conditions join 200-HMA to challenge Yen pair buyers.
  • Three-week-old descending trend line adds to the upside filters.
  • Weekly support line stops bears from retaking control.

USD/JPY struggles around intraday high, after a stellar run-up to 131.66, as the key moving average challenges the Yen pair buyers during early Wednesday. Also testing the upside momentum are the overbought conditions of the Relative Strength Index (RSI) line, placed at 14.

That said, USD/JPY rallied nearly 85 pips on breaking a fortnight-long descending trend line. The recovery moves, however, failed to cross the 200-Hour Moving Average (HMA).

It’s worth noting that the MACD signals are bullish and can join the latest trend line breakout to propel Yen prices beyond the latest HMA hurdle surrounding 131.55.

Even so, a downward-sloping resistance line from March 08, close to 131.90 by the press time, closely followed by the 132.00 round figure, could challenge the USD/JPY bulls.

On the contrary, pullback moves remain elusive unless staying beyond the previous resistance line, around 131.05 at the latest.

Following that, an ascending trend line from the last Friday, close to 130.60, will precede the latest swing low around 129.65 to act as the last defence of the USD/JPY bulls.

To sum up, the USD/JPY pair is likely to grind higher even if the bullish trend appears far from here.

USD/JPY: Hourly chart

Trend: Limited upside expected

Additional important levels

Overview
Today last price 131.55
Today Daily Change 0.68
Today Daily Change % 0.52%
Today daily open 130.87
 
Trends
Daily SMA20 133.79
Daily SMA50 132.72
Daily SMA100 134.15
Daily SMA200 137.36
 
Levels
Previous Daily High 131.6
Previous Daily Low 130.41
Previous Weekly High 133
Previous Weekly Low 129.64
Previous Monthly High 136.92
Previous Monthly Low 128.08
Daily Fibonacci 38.2% 130.86
Daily Fibonacci 61.8% 131.15
Daily Pivot Point S1 130.32
Daily Pivot Point S2 129.76
Daily Pivot Point S3 129.12
Daily Pivot Point R1 131.52
Daily Pivot Point R2 132.16
Daily Pivot Point R3 132.71


Share: Feed news

Information on these pages contains forward-looking statements that involve risks and uncertainties. Markets and instruments profiled on this page are for informational purposes only and should not in any way come across as a recommendation to buy or sell in these assets. You should do your own thorough research before making any investment decisions. FXStreet does not in any way guarantee that this information is free from mistakes, errors, or material misstatements. It also does not guarantee that this information is of a timely nature. Investing in Open Markets involves a great deal of risk, including the loss of all or a portion of your investment, as well as emotional distress. All risks, losses and costs associated with investing, including total loss of principal, are your responsibility. The views and opinions expressed in this article are those of the authors and do not necessarily reflect the official policy or position of FXStreet nor its advertisers. The author will not be held responsible for information that is found at the end of links posted on this page.

If not otherwise explicitly mentioned in the body of the article, at the time of writing, the author has no position in any stock mentioned in this article and no business relationship with any company mentioned. The author has not received compensation for writing this article, other than from FXStreet.

FXStreet and the author do not provide personalized recommendations. The author makes no representations as to the accuracy, completeness, or suitability of this information. FXStreet and the author will not be liable for any errors, omissions or any losses, injuries or damages arising from this information and its display or use. Errors and omissions excepted.

The author and FXStreet are not registered investment advisors and nothing in this article is intended to be investment advice.

Recommended content


Recommended content

Editors’ Picks

EUR/USD clings to daily gains above 1.0650

EUR/USD clings to daily gains above 1.0650

EUR/USD gained traction and turned positive on the day above 1.0650. The improvement seen in risk mood following the earlier flight to safety weighs on the US Dollar ahead of the weekend and helps the pair push higher.

EUR/USD News

GBP/USD recovers toward 1.2450 after UK Retail Sales data

GBP/USD recovers toward 1.2450 after UK Retail Sales data

GBP/USD reversed its direction and advanced to the 1.2450 area after touching a fresh multi-month low below 1.2400 in the Asian session. The positive shift seen in risk mood on easing fears over a deepening Iran-Israel conflict supports the pair.

GBP/USD News

Gold holds steady at around $2,380 following earlier spike

Gold holds steady at around $2,380 following earlier spike

Gold stabilized near $2,380 after spiking above $2,400 with the immediate reaction to reports of Israel striking Iran. Meanwhile, the pullback seen in the US Treasury bond yields helps XAU/USD hold its ground.

Gold News

Bitcoin Weekly Forecast: BTC post-halving rally could be partially priced in Premium

Bitcoin Weekly Forecast: BTC post-halving rally could be partially priced in

Bitcoin price shows no signs of directional bias while it holds above  $60,000. The fourth BTC halving is partially priced in, according to Deutsche Bank’s research. 

Read more

Week ahead – US GDP and BoJ decision on top of next week’s agenda

Week ahead – US GDP and BoJ decision on top of next week’s agenda

US GDP, core PCE and PMIs the next tests for the Dollar. Investors await BoJ for guidance about next rate hike. EU and UK PMIs, as well as Australian CPIs also on tap.

Read more

Forex MAJORS

Cryptocurrencies

Signatures