Gold slips from $4,500 as strong US data dents haven demand
- Gold falls toward $4,465 after ISM Services PMI surprised to the upside, signaling firmer US economic momentum.
- Solid labor indicators temper near-term haven demand, despite markets still pricing Fed cuts in 2026.
- Traders eye Jobless Claims and Nonfarm Payrolls for confirmation of a cooling labor market that could revive Gold bids.

Gold price tumbles nearly 1% on Wednesday after US economic data showed that business activity improved, while the labor market shows signs of being more solid than expected. At the time of writing, XAU/USD trades at $4,465 after reaching a high of $4,500,
Bullion retreats nearly 1% as upbeat US services activity and resilient labor data offset geopolitical risks
The US economic docket was packed with the release of the ISM Services PMI, which surprisingly exceeded estimates and November’s print, while the ADP Employment Change for December, although solid, missed forecasts. Meanwhile, job openings featured a dip compared to October as revealed by the November data, though most of this does not change market participants’ expectations for further Federal Reserve (Fed) easing in 2026.
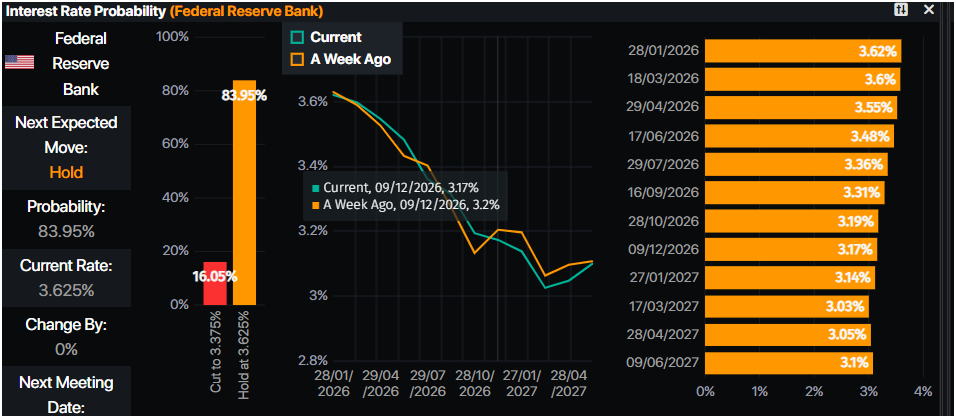
Data from Prime Market Terminal shows that the US central bank is projected to cut rates at least twice towards the end of the year. This means that the Fed funds rate would hit the 3 to 3.25 percent range.
Despite this, Bullion prices remain depressed even though geopolitical risks are piling following last week’s capture of Venezuelan President Nicolas Maduro. US President Donald Trump saidt he plans to acquire Greenland, which includes potential military involvement.
Ahead this week, the economic docket in the US will feature Initial Jobless Claims and the release of December’s Nonfarm Payrolls report, which could push Gold prices higher if the labor market continues to deteriorate.
Daily digest market mover: Bullion pressured by solid US data
- The Institute for Supply Management reported that the ISM Services PMI surged in December, signaling strengthening activity across the services sector. The index jumped from 52.6 to 54.4, comfortably beating expectations of 52.3.
- Digging into the details, the Employment subcomponent climbed back into expansion territory, rising from 48.9 to 52, while Prices Paid eased slightly from 65.4 to 64.3, suggesting some moderation in cost pressures.
- Meanwhile, the US Department of Labor released the November JOLTS report, showing that job openings declined to 7.146 million, down from 7.449 million in October, pointing to a gradual cooling in labor demand.
- The ADP Employment Change showed that private payrolls increased by 41,000 in December, falling short of forecasts for 47,000, but marking a clear improvement from November’s 29,000 job losses, suggesting tentative stabilization in hiring toward year-end.
- Despite falling, physical Gold purchases might cap its downtrend. The People’s Bank of China (PBoC) revealed that it added Bullion to its reserves in December, according to official data.
- An MNI article said “China's gold reserves stood at 74.15 million ounces at the end of December, an increase of 30,000 ounces from the previous month”
- Gold is falling to benefit from falling US Treasury yields. The US 10-year note yield tumbles three basis points to 4.136%. US real yields, which correlate inversely with Gold prices, are tumbling four basis points to 1.866%.
- The US Dollar Index (DXY), which tracks the performance of the American currency versus other six, is flat at 98.61.
Technical analysis: Gold price struggles at $4,500, retreats
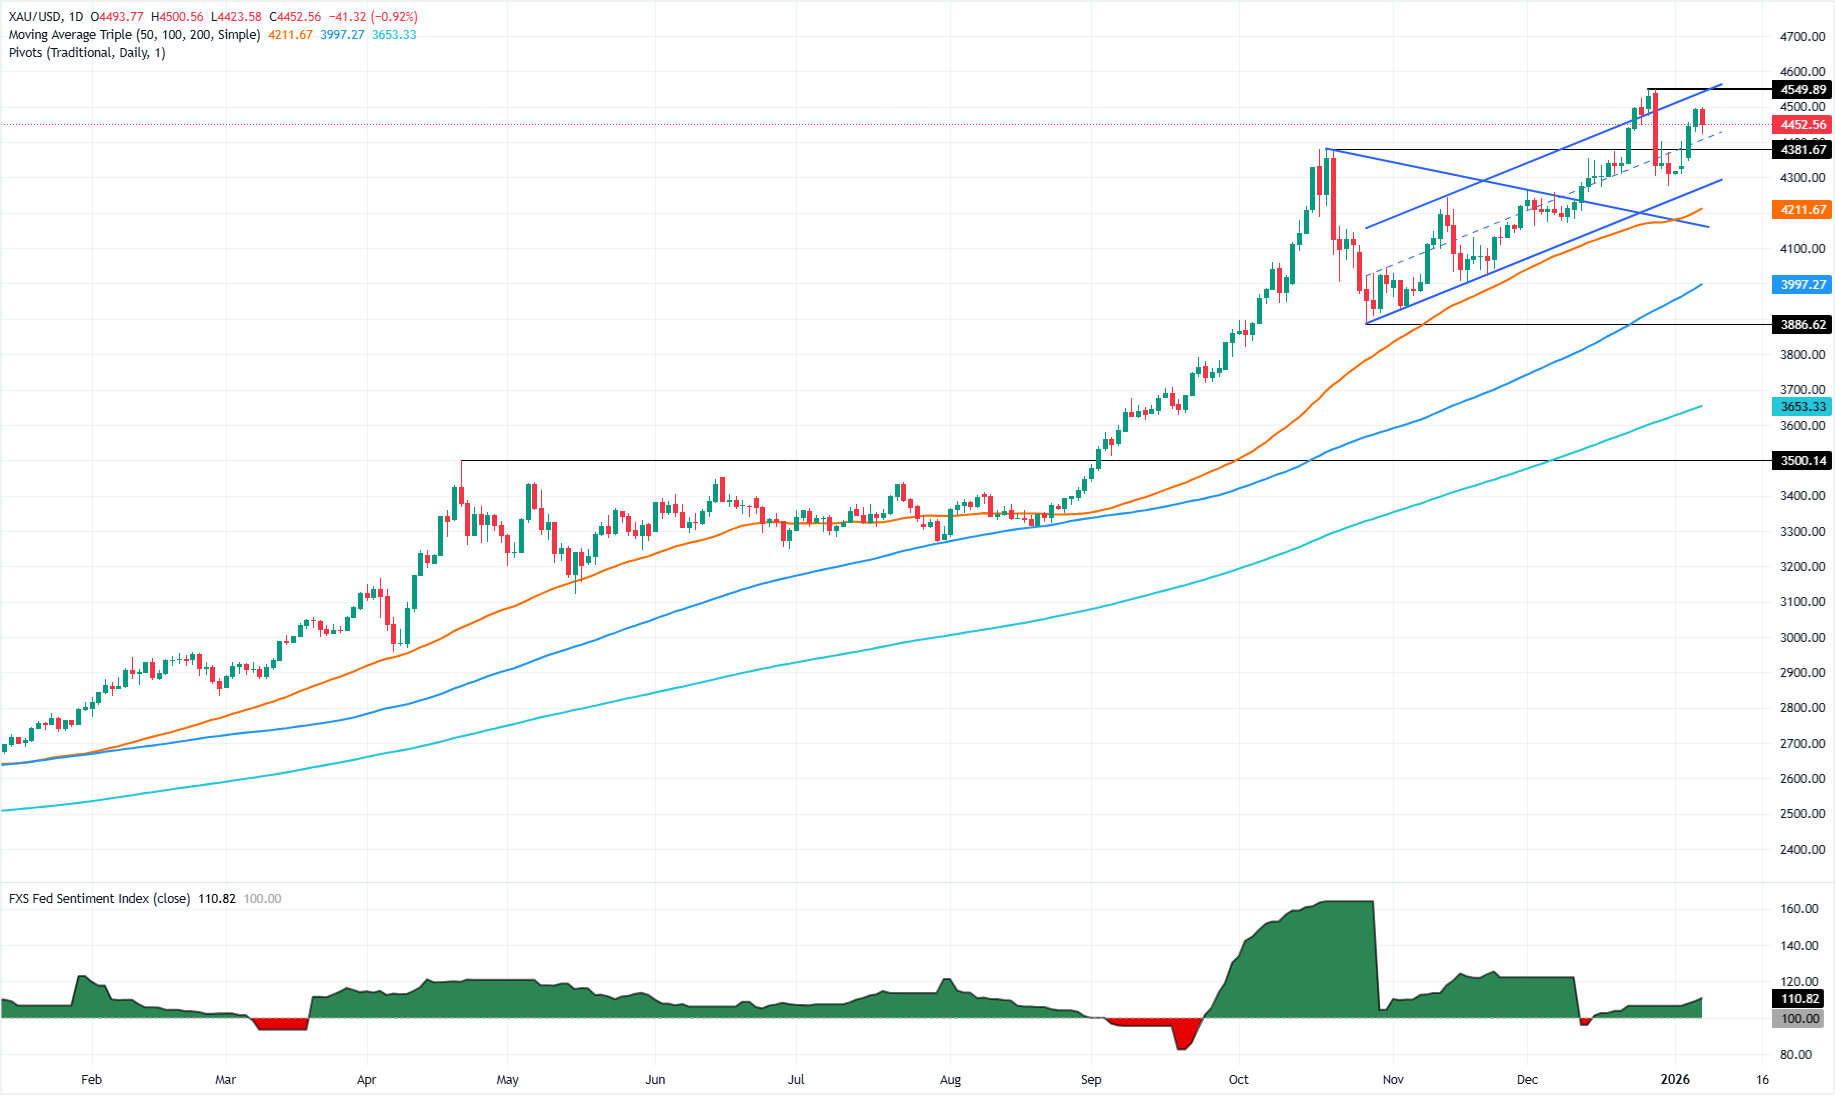
Gold buyers tested $4,500 but were unable to clear it, which exacerbated a pullback towards the $4,450 area. Momentum seems to be shifting from bullish to neutral as depicted by the Relative Strength Index (RSI).
If XAU/USD closes below $4,450 on a daily basis, the fall could continue as the $4,400 would be up next. A breach of the latter will expose the 20-day Simple Moving Average (SMA) at $4,364.
Conversely, if Bullion trades above $4,500, this will put into play the record high at $4,549 before challenging $4,600.
Gold FAQs
Gold has played a key role in human’s history as it has been widely used as a store of value and medium of exchange. Currently, apart from its shine and usage for jewelry, the precious metal is widely seen as a safe-haven asset, meaning that it is considered a good investment during turbulent times. Gold is also widely seen as a hedge against inflation and against depreciating currencies as it doesn’t rely on any specific issuer or government.
Central banks are the biggest Gold holders. In their aim to support their currencies in turbulent times, central banks tend to diversify their reserves and buy Gold to improve the perceived strength of the economy and the currency. High Gold reserves can be a source of trust for a country’s solvency. Central banks added 1,136 tonnes of Gold worth around $70 billion to their reserves in 2022, according to data from the World Gold Council. This is the highest yearly purchase since records began. Central banks from emerging economies such as China, India and Turkey are quickly increasing their Gold reserves.
Gold has an inverse correlation with the US Dollar and US Treasuries, which are both major reserve and safe-haven assets. When the Dollar depreciates, Gold tends to rise, enabling investors and central banks to diversify their assets in turbulent times. Gold is also inversely correlated with risk assets. A rally in the stock market tends to weaken Gold price, while sell-offs in riskier markets tend to favor the precious metal.
The price can move due to a wide range of factors. Geopolitical instability or fears of a deep recession can quickly make Gold price escalate due to its safe-haven status. As a yield-less asset, Gold tends to rise with lower interest rates, while higher cost of money usually weighs down on the yellow metal. Still, most moves depend on how the US Dollar (USD) behaves as the asset is priced in dollars (XAU/USD). A strong Dollar tends to keep the price of Gold controlled, whereas a weaker Dollar is likely to push Gold prices up.
Author

Christian Borjon Valencia
FXStreet
Markets analyst, news editor, and trading instructor with over 14 years of experience across FX, commodities, US equity indices, and global macro markets.


