USD/JPY nears 140.00 mark following US CPI report
- USD/JPY trades at around 139.90s after the release of the US CPI report.
- US inflation shows signs of cooling, providing a rationale for a Fed pause on rate hikes.
- US Dollar Index drops 0.34%, reaching its lowest level since May 23.

USD/JPY rose after the release of the US inflation report in the United States (US) and cemented the case for a Federal Reserve (Fed) pause on its tightening cycle after increasing rates by 500 basis points since March 2022. At the time of writing, USD/JPY trades at 139.90, shy of challenging the 140.00 mark.
Cooling inflation strengthens the case for Fed pause; US Dollar Index at three-week lows
Inflation in the US flashed signs of cooling down in the headline figure, but the core remains stickier. The US Department of Labor revealed the Consumer Price Index (CPI) in May rose by 4% YoY, beneath estimates and less than April’s 4.9%. CPI has printed a lower reading than the previous month for twelve straight months, strengthening the case for a Fed pause.
Nevertheless, core CPI, which excludes volatile items like food and energy, increased to 5.3% YoY, aligned with estimates, but 0.2% below the prior’s month data. Money market futures speculate that Jerome Powell and Co. would increase rates at the July meeting by 25 basis points (bps) to 5.25%-5.50%, as shown by the CME FedWatch Tool, with chances at 58.2%, higher than a week ago.
Following the data release, the USD/JPY seesawed around the 139.00-140.00 area before stabilizing around current exchange rates. Meanwhile, post the US CPI release, US Treasury bond yields are rising, with the 10-year note yielding 3.790%, gaining five basis points (bps), a tailwind for the USD/JPY.
The US Dollar Index (DXY), a measure that tracks the buck’s value against a basket of six currencies, drops 0.34%, exchanges hands at 103.201, its lowest level since May 23, at three-week lows.
Upcoming events
The US economic docket will feature May Producer Price Index (PPI), followed by the US Federal Reserve Open Market Committee (FOMC) monetary policy decision and the Fed Chair Powell press conference.
USD/JPY Price Analysis: Technical outlook
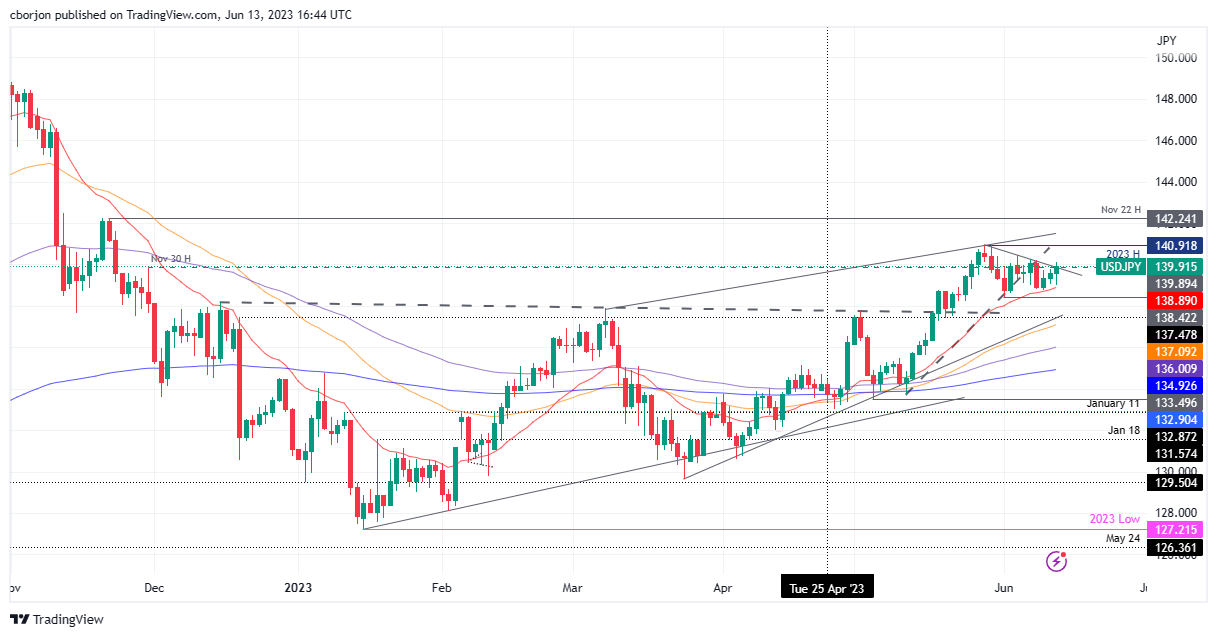
From a daily chart perspective, the USD/JPY pair is neutral to slightly tilted upwards as it sits above the daily Exponential Moving Averages (EMAs). Nevertheless, for a bullish continuation, the USD/JPY must break above the 140.00 mark, so it can threaten the next resistance at the year-to-date (YTD) high of 140.91 before cracking 142.00. Conversely, the USD/JPY could pull back if it breaks below the 20-day EMA at 138.88, exposing as the next demand zone, the month-to-date (MTD) low of 138.42.
Author

Christian Borjon Valencia
FXStreet
Markets analyst, news editor, and trading instructor with over 14 years of experience across FX, commodities, US equity indices, and global macro markets.