USD/JPY leaning into the bearish side in choppy trading
- USD/JPY has seen some whipsaw patterns in recent days.
- BoJ remains dovish on rates, US PMIs beat expectations.
- USD/JPY ran into the 200-hour SMA for the first time since the start of 2024.

USD/JPY heads into the Thursday market session trading near 147.50 after shedding the 148.00 handle on Wednesday. The pair has churned in a rough bearish pattern since peaking near 148.50 last week.
The Bank of Japan (BoJ) remained firmly planted in their dovish monetary policy stance on Tuesday, dedicated to keeping interest rates in negative territory until the Japanese central bank sees enough evidence that inflation in Japan’s domestic economy won’t drop too far below 2% in the future.
The BoJ is also waiting to see how wages shift in the spring, with Japan traditionally seeing salary negotiations take place en masse in the first half of the year.
US Purchasing Managers’ Index (PMI) figures for January broadly beat expectations on Wednesday, with the S&P Global Manufacturing PMI printing at an 11-month high of 50.3 versus the forecast flat print at 47.9. The Services PMI component also gained ground, coming in at 52.9 and vaulting over the forecast decline to 51.0 from the previous month’s 51.4.
Markets are now pivoting to face Thursday’s US Gross Domestic Product (GDP) 4Q update, which is forecast to pullback to 2% from the third quarter’s 4.9 growth print.
The trading week will also close out with another round of Personal Consumption Expenditure (PCE) Price Index figures, with the MoM PCE forecast to tick upwards to 0.2% from 0.1%, and the annualized PCE inflation print is expected to slide from 3.2% to 3.0%. As the Fed’s favored method of tracking inflation, the PCE print for December will be a critical data point for investors hoping for the Fed to get pushed into an accelerated pace of rate cuts.
USD/JPY Technical Outlook
The USD/JPY ran aground on the 200-hour Simple Moving Average (SMA) on Wednesday, dipping into the 146.80 region before rebounding back above the 147.00 handle to settle the day close to 147.50.
Medium-term momentum appears to be tilting into the bearish side as daily candlesticks test new lows after 2024’s 6% bottom-to-top climb from December’s swing low into 140.25. The pair sees the 50-day and 200-day SMAs set to collide in a consolidation pattern, and the USD/JPY will see a long-term technical barrier at the 145.00 major handle.
USD/JPY Hourly Chart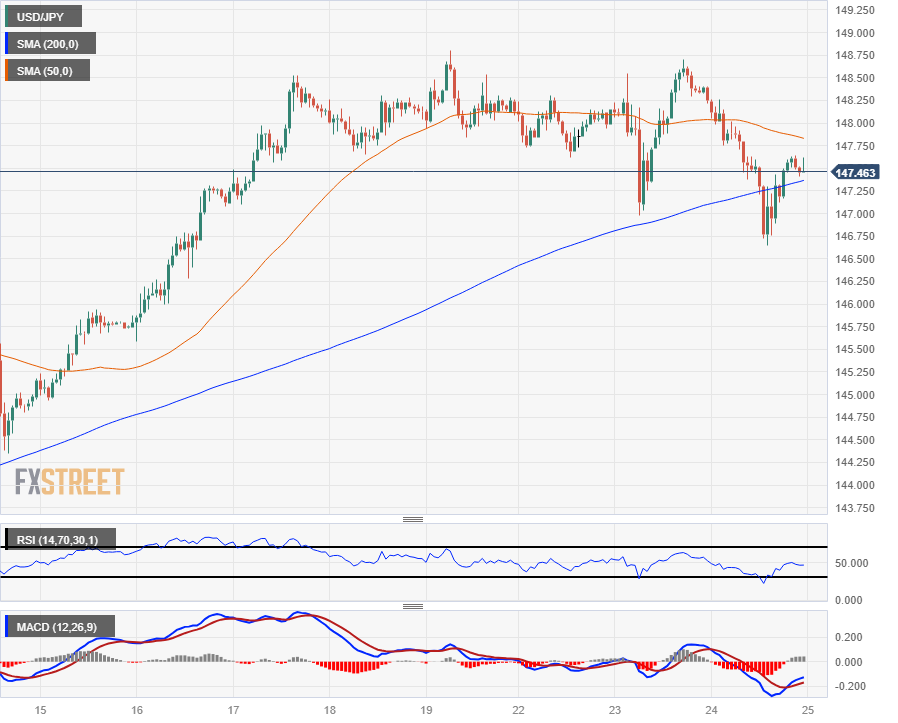
USD/JPY Daily Chart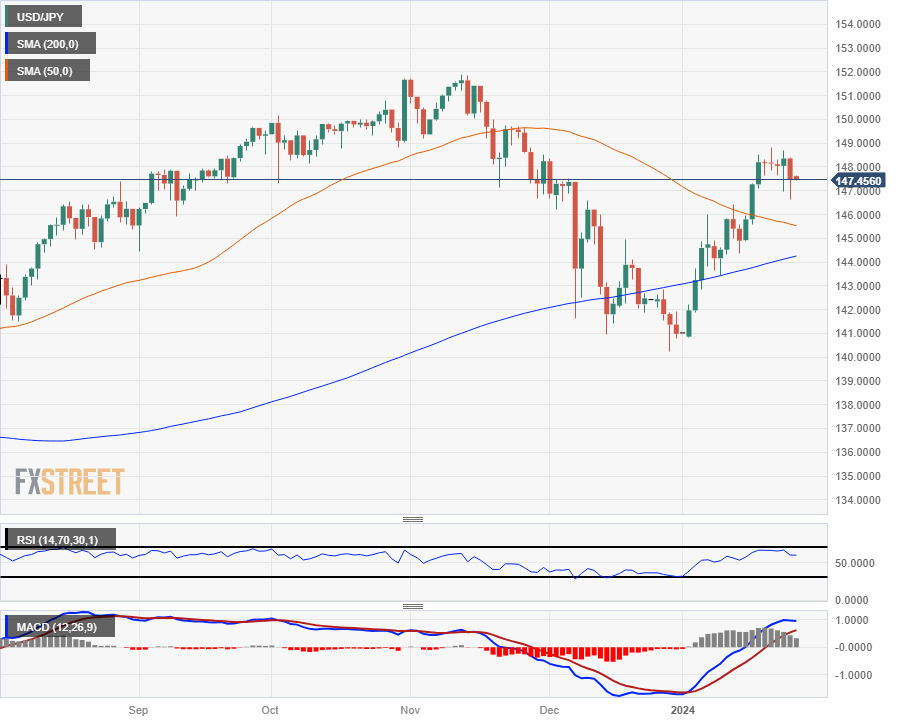
Author

Joshua Gibson
FXStreet
Joshua joins the FXStreet team as an Economics and Finance double major from Vancouver Island University with twelve years' experience as an independent trader focusing on technical analysis.


