USD/JPY drops on its worst day in over a year, breaches 142.00
- USD/JPY is on track for its single-worst performing day in 13 months.
- The Japanese Yen is rally hard across the board, gaining ground against the entire FX market.
- Hints of possible tightening from BoJ Governor Ueda sparked the Yen’s rally on Thursday.

The USD/JPY is on pace to see it’s single worst trading day since November of 2022 after plunging over four percent on Thursday with a broad-market rally for the Japanese Yen (JPY). The USD/JPY tipped into its lowest bids in since August below 142.00 after the Bank of Japan’s (BoJ) Governor Kazuo Ueda hinted that further policy tightening could be on the cards, with an end of the BoJ’s long-running negative rate policy on the table.
Boj Governor Ueda noted that Japan faces an “even more challenging” scenario heading into 2024, highlighting that the BoJ has “several options” on how the Japanese central bank might approach targeting interest rates moving forward.
BoJ finally edging closer to lifting rates?
Japan’s core inflation rate hit 2.9% in October, and Japanese inflation has exceeded the BoJ’s main inflation target rate for well over a year, and the BoJ itself doesn’t anticipate inflation receding below the central bank’s own 2% until sometime in 2025.
Japan’s Core Consumer Price Index (CPI) inflation has hit above the BoJ’s target band for 19 consecutive months. Markets are rapidly increasing their bets that the BoJ will finally be pushed off of their hyper-easy monetary policy perch sooner rather than later, on expectations that wages will begin to finally see moderate wage gains as Japanese workers and consumers grapple with inflation running much hotter for much longer than many expected, eclipsing long-running wage stagnation.
The BoJ next meets for another rate review on December 18 & 19, followed by a quarterly growth and inflation forecast review in late January. Investors will be keeping eyes glued closely to statements coming from the BoJ in the weeks to come as traders look for signs of more than just verbal movement from Japanese policymakers.
Japanese Yen price today
The table below shows the percentage change of Japanese Yen (JPY) against listed major currencies today. Japanese Yen was the strongest against the US Dollar.
| USD | EUR | GBP | CAD | AUD | JPY | NZD | CHF | |
| USD | -0.40% | -0.28% | -0.01% | -0.86% | -2.81% | -0.63% | -0.09% | |
| EUR | 0.41% | 0.11% | 0.40% | -0.45% | -2.40% | -0.22% | 0.33% | |
| GBP | 0.30% | -0.09% | 0.29% | -0.55% | -2.50% | -0.32% | 0.21% | |
| CAD | -0.01% | -0.40% | -0.29% | -0.85% | -2.83% | -0.62% | -0.08% | |
| AUD | 0.87% | 0.48% | 0.57% | 0.86% | -1.92% | 0.25% | 0.77% | |
| JPY | 2.74% | 2.37% | 2.43% | 2.70% | 1.85% | 2.14% | 2.65% | |
| NZD | 0.64% | 0.24% | 0.35% | 0.62% | -0.24% | -2.09% | 0.55% | |
| CHF | 0.09% | -0.30% | -0.20% | 0.08% | -0.77% | -2.72% | -0.54% |
The heat map shows percentage changes of major currencies against each other. The base currency is picked from the left column, while the quote currency is picked from the top row. For example, if you pick the Euro from the left column and move along the horizontal line to the Japanese Yen, the percentage change displayed in the box will represent EUR (base)/JPY (quote).
USD/JPY Technical Outlook
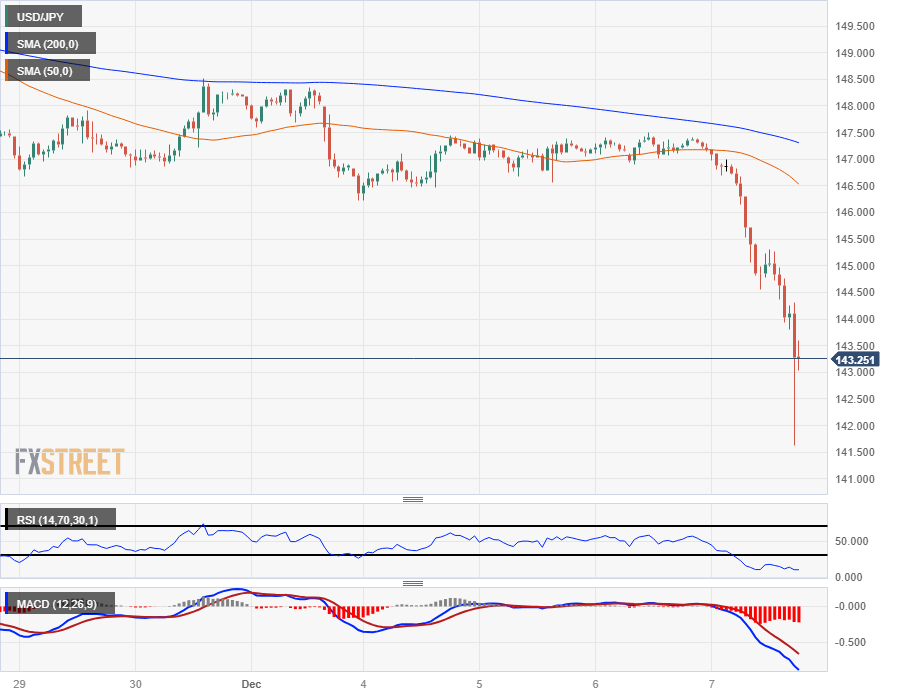
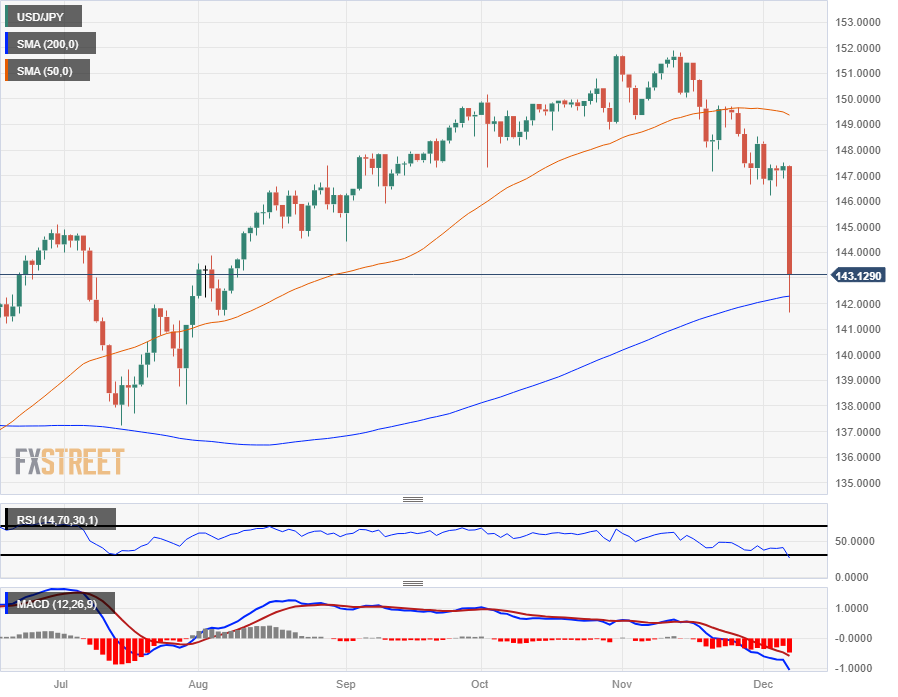
The USD/JPY has accelerated towards the downside, pulling away from intraday levels and pinning near-term technical indicators deep in oversold territory. The pair plunged into touch distance of 141.50, extending declines during the American market session, and the pair is seeing a limited pullback above the 143.00 handle.
Despite paring away some of the day’s more extreme losses, the pair still remains steeply off highs on Thursday, down nearly 2.75% from opening bids near 147.20.
In a single day the USD/JPY went from softly bearish to collapsing into the 200-day Simple Moving Average, and a bullish rebound will need to make significant headway before recovering the 147.00 handle. The 50-day SMA is rotating into a bearish stance well above Thursday’s price action, pushing down into the 1149.00 region.
USD/JPY Hourly Chart
USD/JPY Daily Chart
USD/JPY Technical Levels
Author

Joshua Gibson
FXStreet
Joshua joins the FXStreet team as an Economics and Finance double major from Vancouver Island University with twelve years' experience as an independent trader focusing on technical analysis.


