USD/JPY drops as dovish Fed projections weigh on yields and focus shifts to Powell
- Fed holds rates steady, signals two cuts this year.
- The 2-year yield slipped nearly 5 basis points to 3.9%, pulling USD/JPY lower by 0.45% on the day toward 144.50.
- Traders look to Fed Chair Jerome Powell for clarity on the rate path amid uncertainty over inflation, fiscal policy, and tariffs.

The Japanese Yen (JPY) has extended its advance against the US Dollar (USD) following the Federal Reserve’s policy decision, as traders shift focus to remarks from Fed Chair Jerome Powell.
USD/JPY dropped sharply after the announcement and is now trading around 144.50, down 0.45% on the day, as bond yields declined and rate-cut expectations firmed.
As expected, the Fed left interest rates unchanged at 4.25%–4.50%, with a unanimous decision. Policymakers cited persistent uncertainty surrounding fiscal policy, tariffs, and tax measures, making it difficult to offer clear forward guidance.
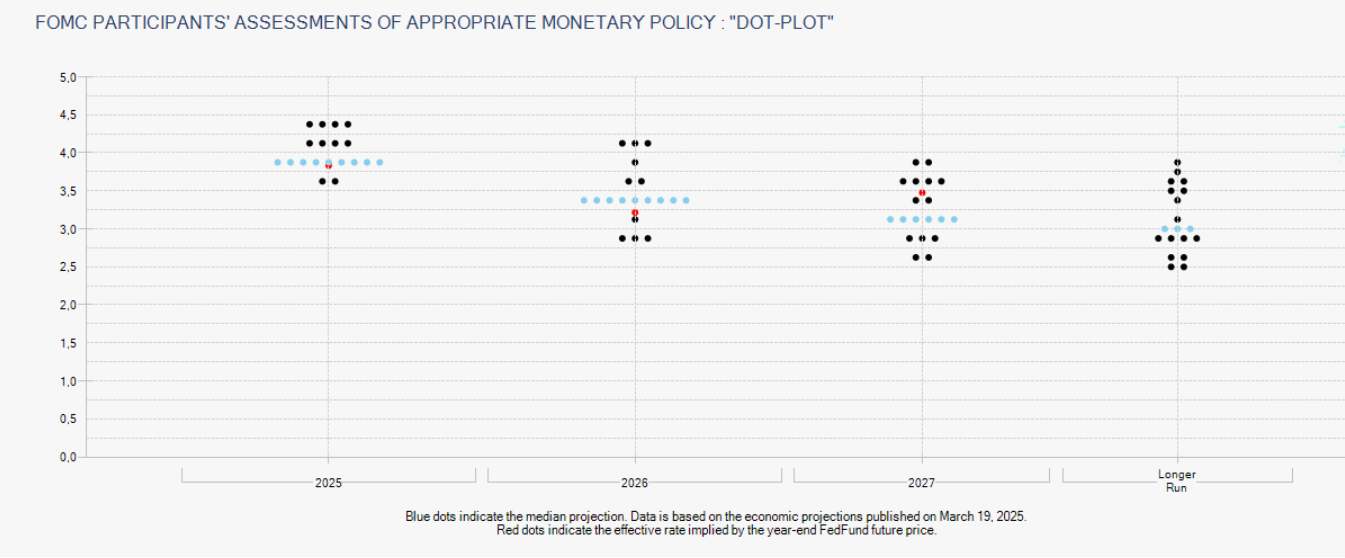
Markets interpreted the update as dovish. Treasury yields fell, with the 2-year note dropping nearly 5 basis points to 3.9%. The updated dot plot signals two rate cuts by the end of 2025, unchanged from the March forecast. Seven FOMC members expect two cuts, while four anticipate just one.
The Fed removed previous language that warned of rising risks from inflation and unemployment. Although uncertainty remains, the labor market is now described as “solid,” with unemployment projected to edge up to 4.5% by year-end.
Core PCE inflation is now forecast at 3.1%, up from 2.8% in March, while headline inflation is projected to reach 3.0%. Economic growth is expected to slow to 1.4% this year, down from the previously projected 1.7%.
All eyes now turn to Fed Chair Powell’s press conference for clarity on the policy outlook. His tone and guidance will be key in determining whether markets maintain expectations for near-term easing or adjust course.
(This story was corrected on June 18 at 19:00 GMT to say that the March dot plot signaled two rate cuts this year, not one.)
Dot Plot FAQs
The “Dot Plot” is the popular name of the interest-rate projections by the Federal Open Market Committee (FOMC) of the US Federal Reserve (Fed), which implements monetary policy. These are published in the Summary of Economic Projections, a report in which FOMC members also release their individual projections on economic growth, the unemployment rate and inflation for the current year and the next few ones. The document consists of a chart plotting interest-rate projections, with each FOMC member’s forecast represented by a dot. The Fed also adds a table summarizing the range of forecasts and the median for each indicator. This makes it easier for market participants to see how policymakers expect the US economy to perform in the near, medium and long term.
The US Federal Reserve publishes the “Dot Plot” once every other meeting, or in four of the eight yearly scheduled meetings. The Summary of Economic Projections report is published along with the monetary policy decision.
The “Dot Plot” gives a comprehensive insight into the expectations from Federal Reserve (Fed) policymakers. As projections reflect each official’s projection for interest rates at the end of each year, it is considered a key forward-looking indicator. By looking at the “Dot Plot” and comparing the data to current interest-rate levels, market participants can see where policymakers expect rates to head to and the overall direction of monetary policy. As projections are released quarterly, the “Dot Plot” is widely used as a guide to figure out the terminal rate and the possible timing of a policy pivot.
The most market-moving data in the “Dot Plot” is the projection of the federal funds rate. Any change compared with previous projections is likely to influence the US Dollar (USD) valuation. Generally, if the “Dot Plot” shows that policymakers expect higher interest rates in the near term, this tends to be bullish for USD. Likewise, if projections point to lower rates ahead, the USD is likely to weaken.
Author

Tammy Da Costa, CFTe®
FXStreet
Tammy is an economist and market analyst with a deep passion for financial markets, particularly commodities and geopolitics.


