USD/JPY bears testing critical support and bull's commitments
- USD/JPY slid to a fresh low as the US dollar falls out of the market's favour.
- Investors are on the hunt for yield as risk appetite improves.

USD/JPY is trading at 103.53 between the day's range of 103.32 and 103.66 following a bout of supply earlier the week.
The bulls were denied their glory at the start of the week when the market dumped the dollar for higher yielders which, invertedly, took the yen along for the ride.
The yen continues to be supported on an under-belly of risk-off themes and catches a bid when the dollar falls out of the market's favour.
Sentiment for the dollar is related to fiscal spending but we had some good US data this morning.
Treasury yields were mostly higher and the yield curve steepened after US labour market data showed new claims for jobless benefits declined modestly last week.
There were also upbeat housing starts data and a higher factory index for the mid-Atlantic region.
We're also hearing relatively positive, or maybe even borderline hawkish comments from global central bank officials of late following yesterday's Bank of Canada and today's European Central Bank.
Such rhetoric would be expected to weigh on the greenback as investors bank on a faster global economic recovery, not just in the US.
Meanwhile, Asian stocks reached new highs overnight which has helped Wall Street to ride further.
MSCI's global index of stock performance across 50 countries IACWI gained 0.3%.
Overall, many analysts expect the dollar to continue its downtrend trend, which saw it lose nearly 7% in 2020 amid ultra-loose US monetary policy and hopes for a post-pandemic global recovery.
However, there are likely bumps along the way for Biden as he tries to get another $2 to $3 trillion out there in spending approved which could benefit the greenback in the near term.
Also, trade wars are starting to rear their ugly head again which might deter investors from taking on more risk, encouraging, instead, a flight into US Treasuries.
USD/JPY technical analysis
Technically, there is still a bullish bias in USD/JPY from a longer-term perspective.
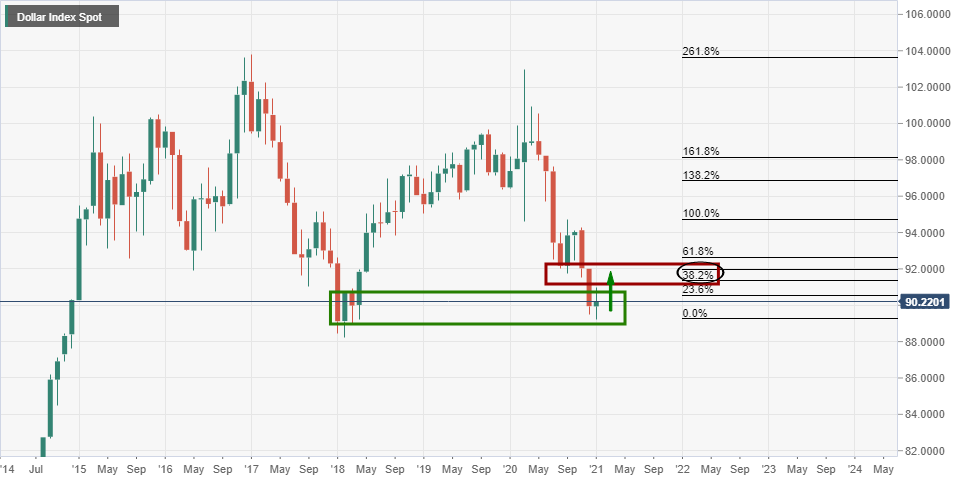
When comparing the monthly chart in the DXY to that of the weekly and daily charts, the bullish bias is compelling.
DXY monthly chart
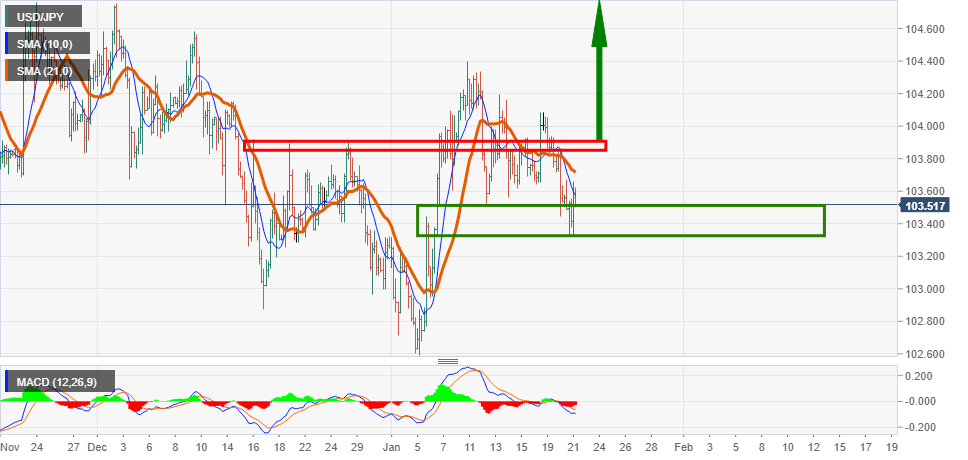
USD/JPY daily chart
The daily chart illustrates that the price has been unable to convincingly break below the 21-day moving average and is supported, instead, at a confluence area.
The area consists of prior highs and the combination of the 50% and 61.8% Fibonacci retracement zone.
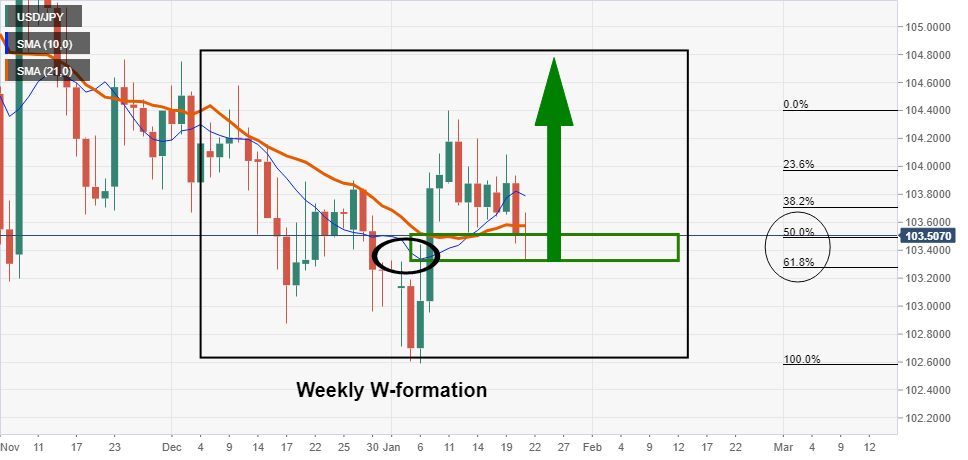
This is also where the nose of the weekly W-formation is located which may also act as a strong level os support.
A break, however, below this confluence of support will cement the case for a downside continuation.
4-hour chart
Meanwhile, the technical environment is bearish on the 4-hour chart and only a bid through the 103.90 resistance structure will open up bullish prospects for the market once again.
Author

Ross J Burland
FXStreet
Ross J Burland, born in England, UK, is a sportsman at heart. He played Rugby and Judo for his county, Kent and the South East of England Rugby team.


