|

USD/INR Technical Analysis: 10-day EMA keep driving buyers to 72.37/38 supply zone

  • USD/INR bounces off 10-day EMA amid bullish RSI conditions.
  • Highs marked during late-August, mid-November keep buyers in check.
  • Lows flashed during early-August, late-September offer strong downside support.

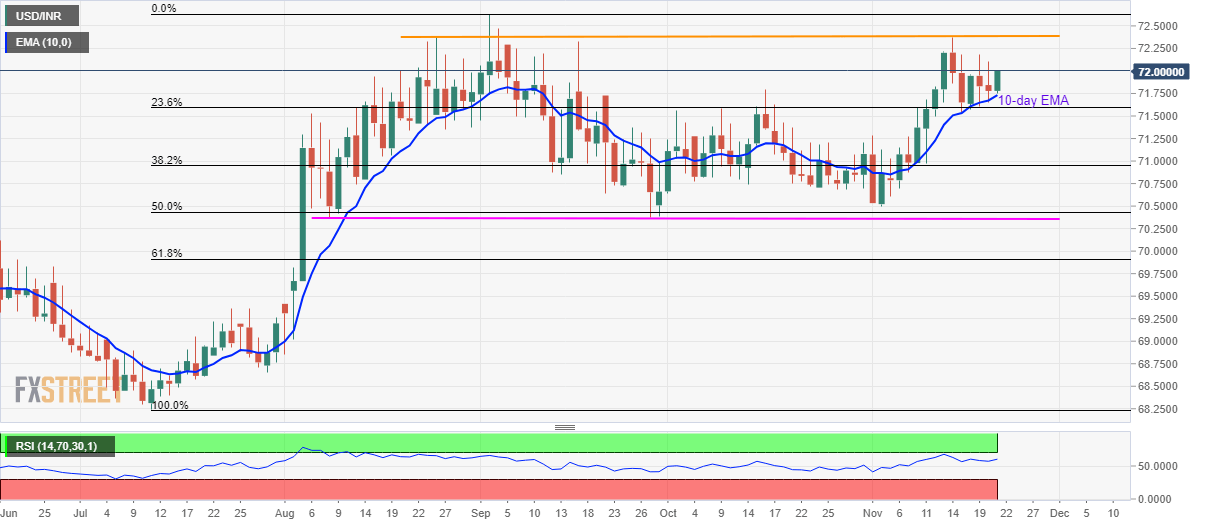
With it’s yet another U-turn from 10-day EMA, USD/INR takes the bids to 72.00 during Thursday’s Asian session.

The price recovery is also supported by bullish conditions of the 14-day Relative Strength Index (RSI), which in turn favors the quote’s further upside.

In doing so, highs marked during late-August and mid-November, around 72.37/38 will be the key to watch as a break of which could escalate the pair’s run-up to the yearly top close to 72.65 while highlighting December 2018 peak of 72.82 afterward.

Should there be a downside below the 10-day Exponential Moving Average (EMA) level of 71.73, sellers can target 71.50 ahead of aiming November-start top of 71.28.

It’s worth mentioning that the pair’s sustained declines below 71.28 can have 71.00 as a buffer prior to visiting the early-August and September month lows, near 70.37/36.

USD/INR daily chart

Trend: Pullback expected

additional important levels

Overview
Today last price71.7772
Today Daily Change-0.0533
Today Daily Change %-0.07%
Today daily open71.8305
 
Trends
Daily SMA2071.2372
Daily SMA5071.1575
Daily SMA10070.7191
Daily SMA20070.2134
 
Levels
Previous Daily High72.18
Previous Daily Low71.611
Previous Weekly High72.37
Previous Weekly Low70.97
Previous Monthly High71.79
Previous Monthly Low70.6425
Daily Fibonacci 38.2%71.8284
Daily Fibonacci 61.8%71.9626
Daily Pivot Point S171.5677
Daily Pivot Point S271.3048
Daily Pivot Point S370.9987
Daily Pivot Point R172.1367
Daily Pivot Point R272.4428
Daily Pivot Point R372.7057

Author

Anil Panchal

Anil Panchal

FXStreet

Anil Panchal has nearly 15 years of experience in tracking financial markets. With a keen interest in macroeconomics, Anil aptly tracks global news/updates and stays well-informed about the global financial moves and their implications.

More from Anil Panchal
Share:

Editor's Picks

EUR/USD stays near 1.1650 with fading momentum

EUR/USD holds ground after five days of losses, trading around 1.1650 during the Asian hours on Friday. The 14-day Relative Strength Index momentum indicator at 39 trends lower, confirming fading momentum rather than oversold conditions.

GBP/USD remains below 1.3450, nine-day EMA

GBP/USD remains subdued for the fourth consecutive day, trading around 1.3430 during the Asian hours on Friday. The momentum indicator 14-day Relative Strength Index at 51.9 is neutral, reflecting slower momentum after firm recent readings. An RSI drop back beneath 50 would strengthen the case for a deeper pullback.

Gold edges lower as USD preserves its recent gains ahead of US NFP report

Gold struggles to capitalize on the previous day's goodish rebound from the vicinity of the $4,400 mark and attracts fresh sellers during the Asian session on Friday. The US Dollar preserves its gains registered over the past two weeks and touches a nearly one-month high, undermining the commodity. 

Bitcoin, Ethereum and Ripple find key support, reviving rally hopes

Bitcoin, Ethereum, and Ripple steadied above key support levels on Friday after being rejected at mid-week resistance zones. The short-term recovery prospects remain intact if the top three cryptocurrencies by market capitalization hold these support zones.

2026 economic outlook: Clear skies but don’t unfasten your seatbelts yet

Most years fade into the background as soon as a new one starts. Not 2025: a year of epochal shifts, in which the macroeconomy was the dog that did not bark. What to expect in 2026? The shocks of 2025 will not be undone, but neither will they be repeated.

Pepe Price Forecast: PEPE risks 100-day EMA fallout as bullish interest fades

Pepe is under extreme selling pressure, trading in the red for the fifth consecutive day, down 1% at press time on Friday. Pepe’s decline following a 72% hike last week suggests a likely profit-booking phase, while on-chain data indicates declining network activity.