USD/INR Price News: Wednesday’s shooting star tests Indian rupee bears below 75.50


  • USD/INR takes offers towards the intraday low while easing from 10-month top flashed the previous day.
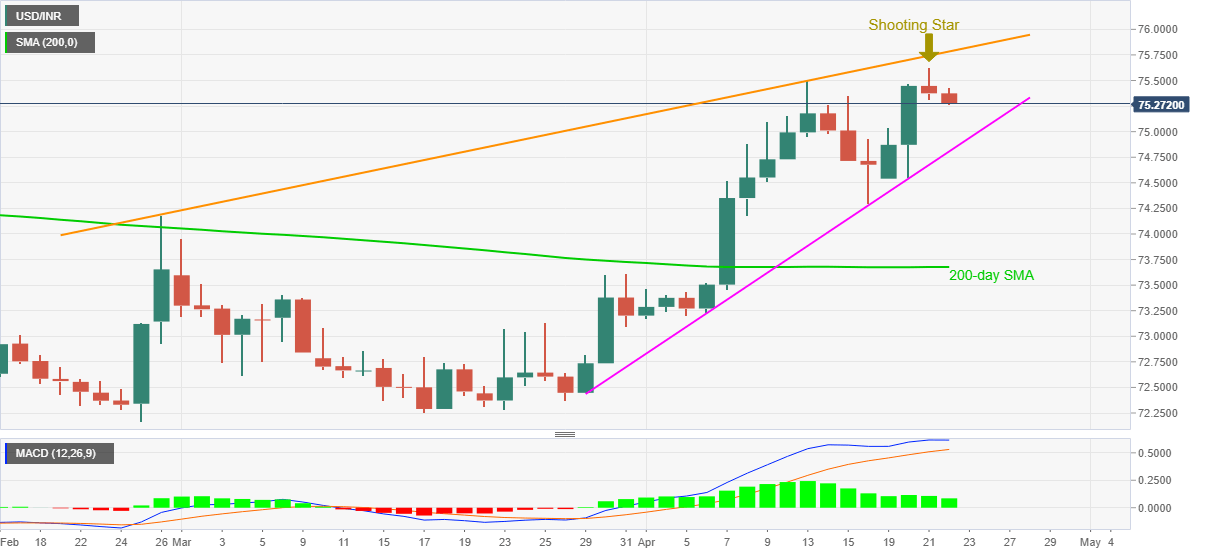
  • Bearish candlestick formation on the daily chart, receding bullish MACD bias challenge upside momentum.
  • Sellers may look for entries below one-month-old support line.

USD/INR drops towards the intraday low of 73.26 amid the initial Indian session trading on Thursday.

The Indian rupee pair rallied to the highest since late June 2020 the previous day before snapping a two-day uptrend. The pullback moves portrayed a “shooting star” bearish candlestick on the daily timeframe.

Also supporting the odds of consolidation is the easing conditions of the bullish MACD signals in recent days.

However, the 75.00 round figure and an ascending trend line from March 26, around 74.80 by the press time, will be tough nuts to crack for the USD/INR sellers.

Meanwhile, an upside break of 75.63 will defy the bearish candlestick signals but any further run-up may dwindle around a two-month-long rising resistance line, close to 75.80.

Overall, USD/INR remains bullish but a profit-booking move can’t be ruled out.

USD/INR daily chart

Trend: Pullback expected

Additional important levels

Overview
Today last price 75.358
Today Daily Change -0.0166
Today Daily Change % -0.02%
Today daily open 75.3746
 
Trends
Daily SMA20 74.0855
Daily SMA50 73.2922
Daily SMA100 73.2942
Daily SMA200 73.677
 
Levels
Previous Daily High 75.6321
Previous Daily Low 75.3111
Previous Weekly High 75.496
Previous Weekly Low 74.298
Previous Monthly High 73.958
Previous Monthly Low 72.2569
Daily Fibonacci 38.2% 75.4337
Daily Fibonacci 61.8% 75.5095
Daily Pivot Point S1 75.2465
Daily Pivot Point S2 75.1183
Daily Pivot Point S3 74.9255
Daily Pivot Point R1 75.5675
Daily Pivot Point R2 75.7603
Daily Pivot Point R3 75.8885


Share: Feed news

Information on these pages contains forward-looking statements that involve risks and uncertainties. Markets and instruments profiled on this page are for informational purposes only and should not in any way come across as a recommendation to buy or sell in these assets. You should do your own thorough research before making any investment decisions. FXStreet does not in any way guarantee that this information is free from mistakes, errors, or material misstatements. It also does not guarantee that this information is of a timely nature. Investing in Open Markets involves a great deal of risk, including the loss of all or a portion of your investment, as well as emotional distress. All risks, losses and costs associated with investing, including total loss of principal, are your responsibility. The views and opinions expressed in this article are those of the authors and do not necessarily reflect the official policy or position of FXStreet nor its advertisers. The author will not be held responsible for information that is found at the end of links posted on this page.

If not otherwise explicitly mentioned in the body of the article, at the time of writing, the author has no position in any stock mentioned in this article and no business relationship with any company mentioned. The author has not received compensation for writing this article, other than from FXStreet.

FXStreet and the author do not provide personalized recommendations. The author makes no representations as to the accuracy, completeness, or suitability of this information. FXStreet and the author will not be liable for any errors, omissions or any losses, injuries or damages arising from this information and its display or use. Errors and omissions excepted.

The author and FXStreet are not registered investment advisors and nothing in this article is intended to be investment advice.

Recommended content


Recommended content

Editors’ Picks

AUD/USD could extend the recovery to 0.6500 and above

AUD/USD could extend the recovery to 0.6500 and above

The enhanced risk appetite and the weakening of the Greenback enabled AUD/USD to build on the promising start to the week and trade closer to the key barrier at 0.6500 the figure ahead of key inflation figures in Australia.

AUD/USD News

EUR/USD now refocuses on the 200-day SMA

EUR/USD now refocuses on the 200-day SMA

EUR/USD extended its positive momentum and rose above the 1.0700 yardstick, driven by the intense PMI-led retracement in the US Dollar as well as a prevailing risk-friendly environment in the FX universe.

EUR/USD News

Gold struggles around $2,325 despite broad US Dollar’s weakness

Gold struggles around $2,325 despite broad US Dollar’s weakness

Gold reversed its direction and rose to the $2,320 area, erasing a large portion of its daily losses in the process. The benchmark 10-year US Treasury bond yield stays in the red below 4.6% following the weak US PMI data and supports XAU/USD.

Gold News

Bitcoin price makes run for previous cycle highs as Morgan Stanley pushes BTC ETF exposure

Bitcoin price makes run for previous cycle highs as Morgan Stanley pushes BTC ETF exposure

Bitcoin (BTC) price strength continues to grow, three days after the fourth halving. Optimism continues to abound in the market as Bitcoiners envision a reclamation of previous cycle highs.

Read more

US versus the Eurozone: Inflation divergence causes monetary desynchronization

US versus the Eurozone: Inflation divergence causes monetary desynchronization

Historically there is a very close correlation between changes in US Treasury yields and German Bund yields. This is relevant at the current juncture, considering that the recent hawkish twist in the tone of the Federal Reserve might continue to push US long-term interest rates higher and put upward pressure on bond yields in the Eurozone. 

Read more

Forex MAJORS

Cryptocurrencies

Signatures