USD/INR Price News: Indian rupee stalls its decline ahead of 74.75 key support


  • USD/INR consolidates before the next push higher towards 75.00.
  • The spot wavers inside a rising channel, awaiting a fresh impetus.
  • Bullish RSI, crossover point to a test of the channel hurdle at 74.75.

USD/INR is clinging onto the recent trading range around the midpoint of 74.00, having finished Tuesday almost unchanged despite a renewed upside in oil prices.  

However, the consolidation in the prices could be seen as the onset of a new uptrend in the currency pair, as the bulls brace for a rally to 75.00 and beyond.

USD/INR remains capped below the five-week-old rising channel upper boundary at 74.75, awaiting a buying resurgence in the session ahead.

A daily closing above that level is needed to unleash additional gains towards the 75.00 round number.

Further, buyers will target the April highs near 75.60 if the bulls fight back complete control.  

The 14-day Relative Strength Index remains flatlined, sitting just beneath the overbought region, suggesting that there remains more room to the upside.

A bear cross, represented by the 21-Daily Moving Average (DMA) cutting through the 100-DMA from below, adds credence to a potential move higher.

USD/INR: Daily chart

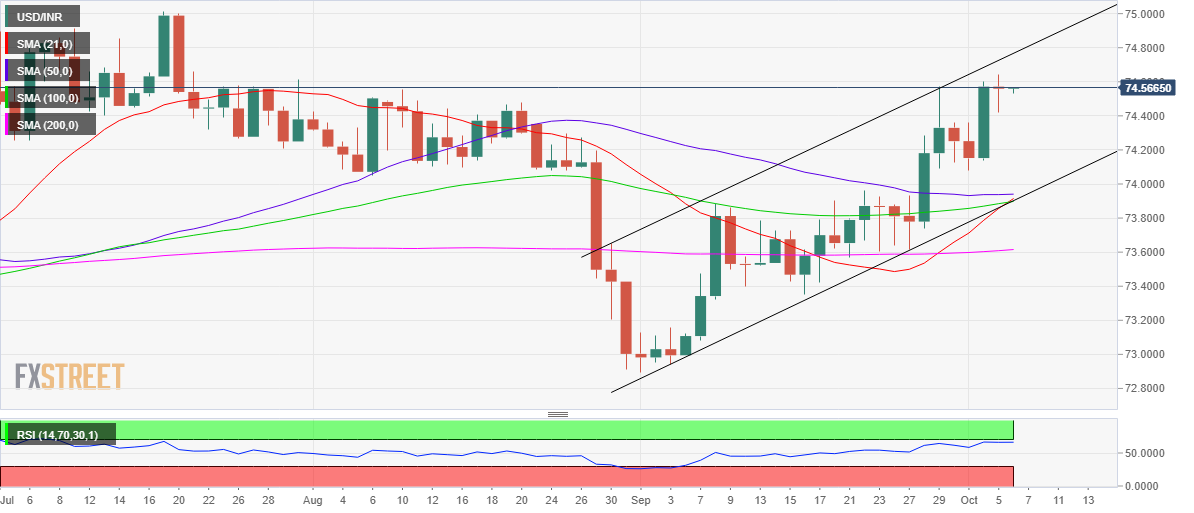
On the flip side, immediate support is seen at Tuesday’s low of 74.42, below which a drop towards the horizontal 50-Daily Moving Average (DMA) at 73.93 cannot be ruled out.

At that point, the 21 and 100-DMAs coincide, making it a powerful demand area.

A breach of the last on a sustained break would validate a rising channel breakdown, opening floors towards the horizontal 200-DMA support at 73.61.

USD/INR: Additional levels

USD/INR

Overview
Today last price 74.5415
Today Daily Change -0.0180
Today Daily Change % -0.02
Today daily open 74.5595
 
Trends
Daily SMA20 73.8823
Daily SMA50 73.9377
Daily SMA100 73.8846
Daily SMA200 73.6086
 
Levels
Previous Daily High 74.645
Previous Daily Low 74.4207
Previous Weekly High 74.5742
Previous Weekly Low 73.6144
Previous Monthly High 74.5742
Previous Monthly Low 72.8965
Daily Fibonacci 38.2% 74.5064
Daily Fibonacci 61.8% 74.5593
Daily Pivot Point S1 74.4385
Daily Pivot Point S2 74.3174
Daily Pivot Point S3 74.2142
Daily Pivot Point R1 74.6628
Daily Pivot Point R2 74.766
Daily Pivot Point R3 74.8871


Share: Feed news

Information on these pages contains forward-looking statements that involve risks and uncertainties. Markets and instruments profiled on this page are for informational purposes only and should not in any way come across as a recommendation to buy or sell in these assets. You should do your own thorough research before making any investment decisions. FXStreet does not in any way guarantee that this information is free from mistakes, errors, or material misstatements. It also does not guarantee that this information is of a timely nature. Investing in Open Markets involves a great deal of risk, including the loss of all or a portion of your investment, as well as emotional distress. All risks, losses and costs associated with investing, including total loss of principal, are your responsibility. The views and opinions expressed in this article are those of the authors and do not necessarily reflect the official policy or position of FXStreet nor its advertisers. The author will not be held responsible for information that is found at the end of links posted on this page.

If not otherwise explicitly mentioned in the body of the article, at the time of writing, the author has no position in any stock mentioned in this article and no business relationship with any company mentioned. The author has not received compensation for writing this article, other than from FXStreet.

FXStreet and the author do not provide personalized recommendations. The author makes no representations as to the accuracy, completeness, or suitability of this information. FXStreet and the author will not be liable for any errors, omissions or any losses, injuries or damages arising from this information and its display or use. Errors and omissions excepted.

The author and FXStreet are not registered investment advisors and nothing in this article is intended to be investment advice.

Recommended content


Recommended content

Editors’ Picks

EUR/USD regains traction, recovers above 1.0700

EUR/USD regains traction, recovers above 1.0700

EUR/USD regained its traction and turned positive on the day above 1.0700 in the American session. The US Dollar struggles to preserve its strength after the data from the US showed that the economy grew at a softer pace than expected in Q1.

EUR/USD News

GBP/USD returns to 1.2500 area in volatile session

GBP/USD returns to 1.2500 area in volatile session

GBP/USD reversed its direction and recovered to 1.2500 after falling to the 1.2450 area earlier in the day. Although markets remain risk-averse, the US Dollar struggles to find demand following the disappointing GDP data.

GBP/USD News

Gold climbs above $2,340 following earlier drop

Gold climbs above $2,340 following earlier drop

Gold fell below $2,320 in the early American session as US yields shot higher after the data showed a significant increase in the US GDP price deflator in Q1. With safe-haven flows dominating the markets, however, XAU/USD reversed its direction and rose above $2,340.

Gold News

XRP extends its decline, crypto experts comment on Ripple stablecoin and benefits for XRP Ledger

XRP extends its decline, crypto experts comment on Ripple stablecoin and benefits for XRP Ledger

Ripple extends decline to $0.52 on Thursday, wipes out weekly gains. Crypto expert asks Ripple CTO how the stablecoin will benefit the XRP Ledger and native token XRP. 

Read more

After the US close, it’s the Tokyo CPI

After the US close, it’s the Tokyo CPI

After the US close, it’s the Tokyo CPI, a reliable indicator of the national number and then the BoJ policy announcement. Tokyo CPI ex food and energy in Japan was a rise to 2.90% in March from 2.50%.

Read more

Forex MAJORS

Cryptocurrencies

Signatures