|

USD/INR Price Analysis: Semes poised to surpass record high and conquer 84.00 mark

  • USD/INR consolidates its weekly gains and remains below the monthly swing peak.
  • The USD stands tall near a 10-month high and supports prospects for further gains.
  • Bulls might still wait for a move beyond the 82.30-35 area before placing fresh bets.

The USD/INR pair struggles to capitalize on its gains registered over the past two days and oscillates in a narrow trading band through the Asian session on Wednesday. Spot prices currently trade just below the monthly peak, around the 83.30-83.35 region touched last week, which should now act as a key pivotal point for short-term traders.

The US Dollar (USD) advances to a fresh 10-month high in the wake of growing acceptance that the Federal Reserve (Fed) will keep rates higher for longer, which remains supportive of elevated US Treasury bond yields. Apart from this, a weaker risk tone further benefits the Greenback's relative safe-haven status and should act as a tailwind for the USD/INR pair.

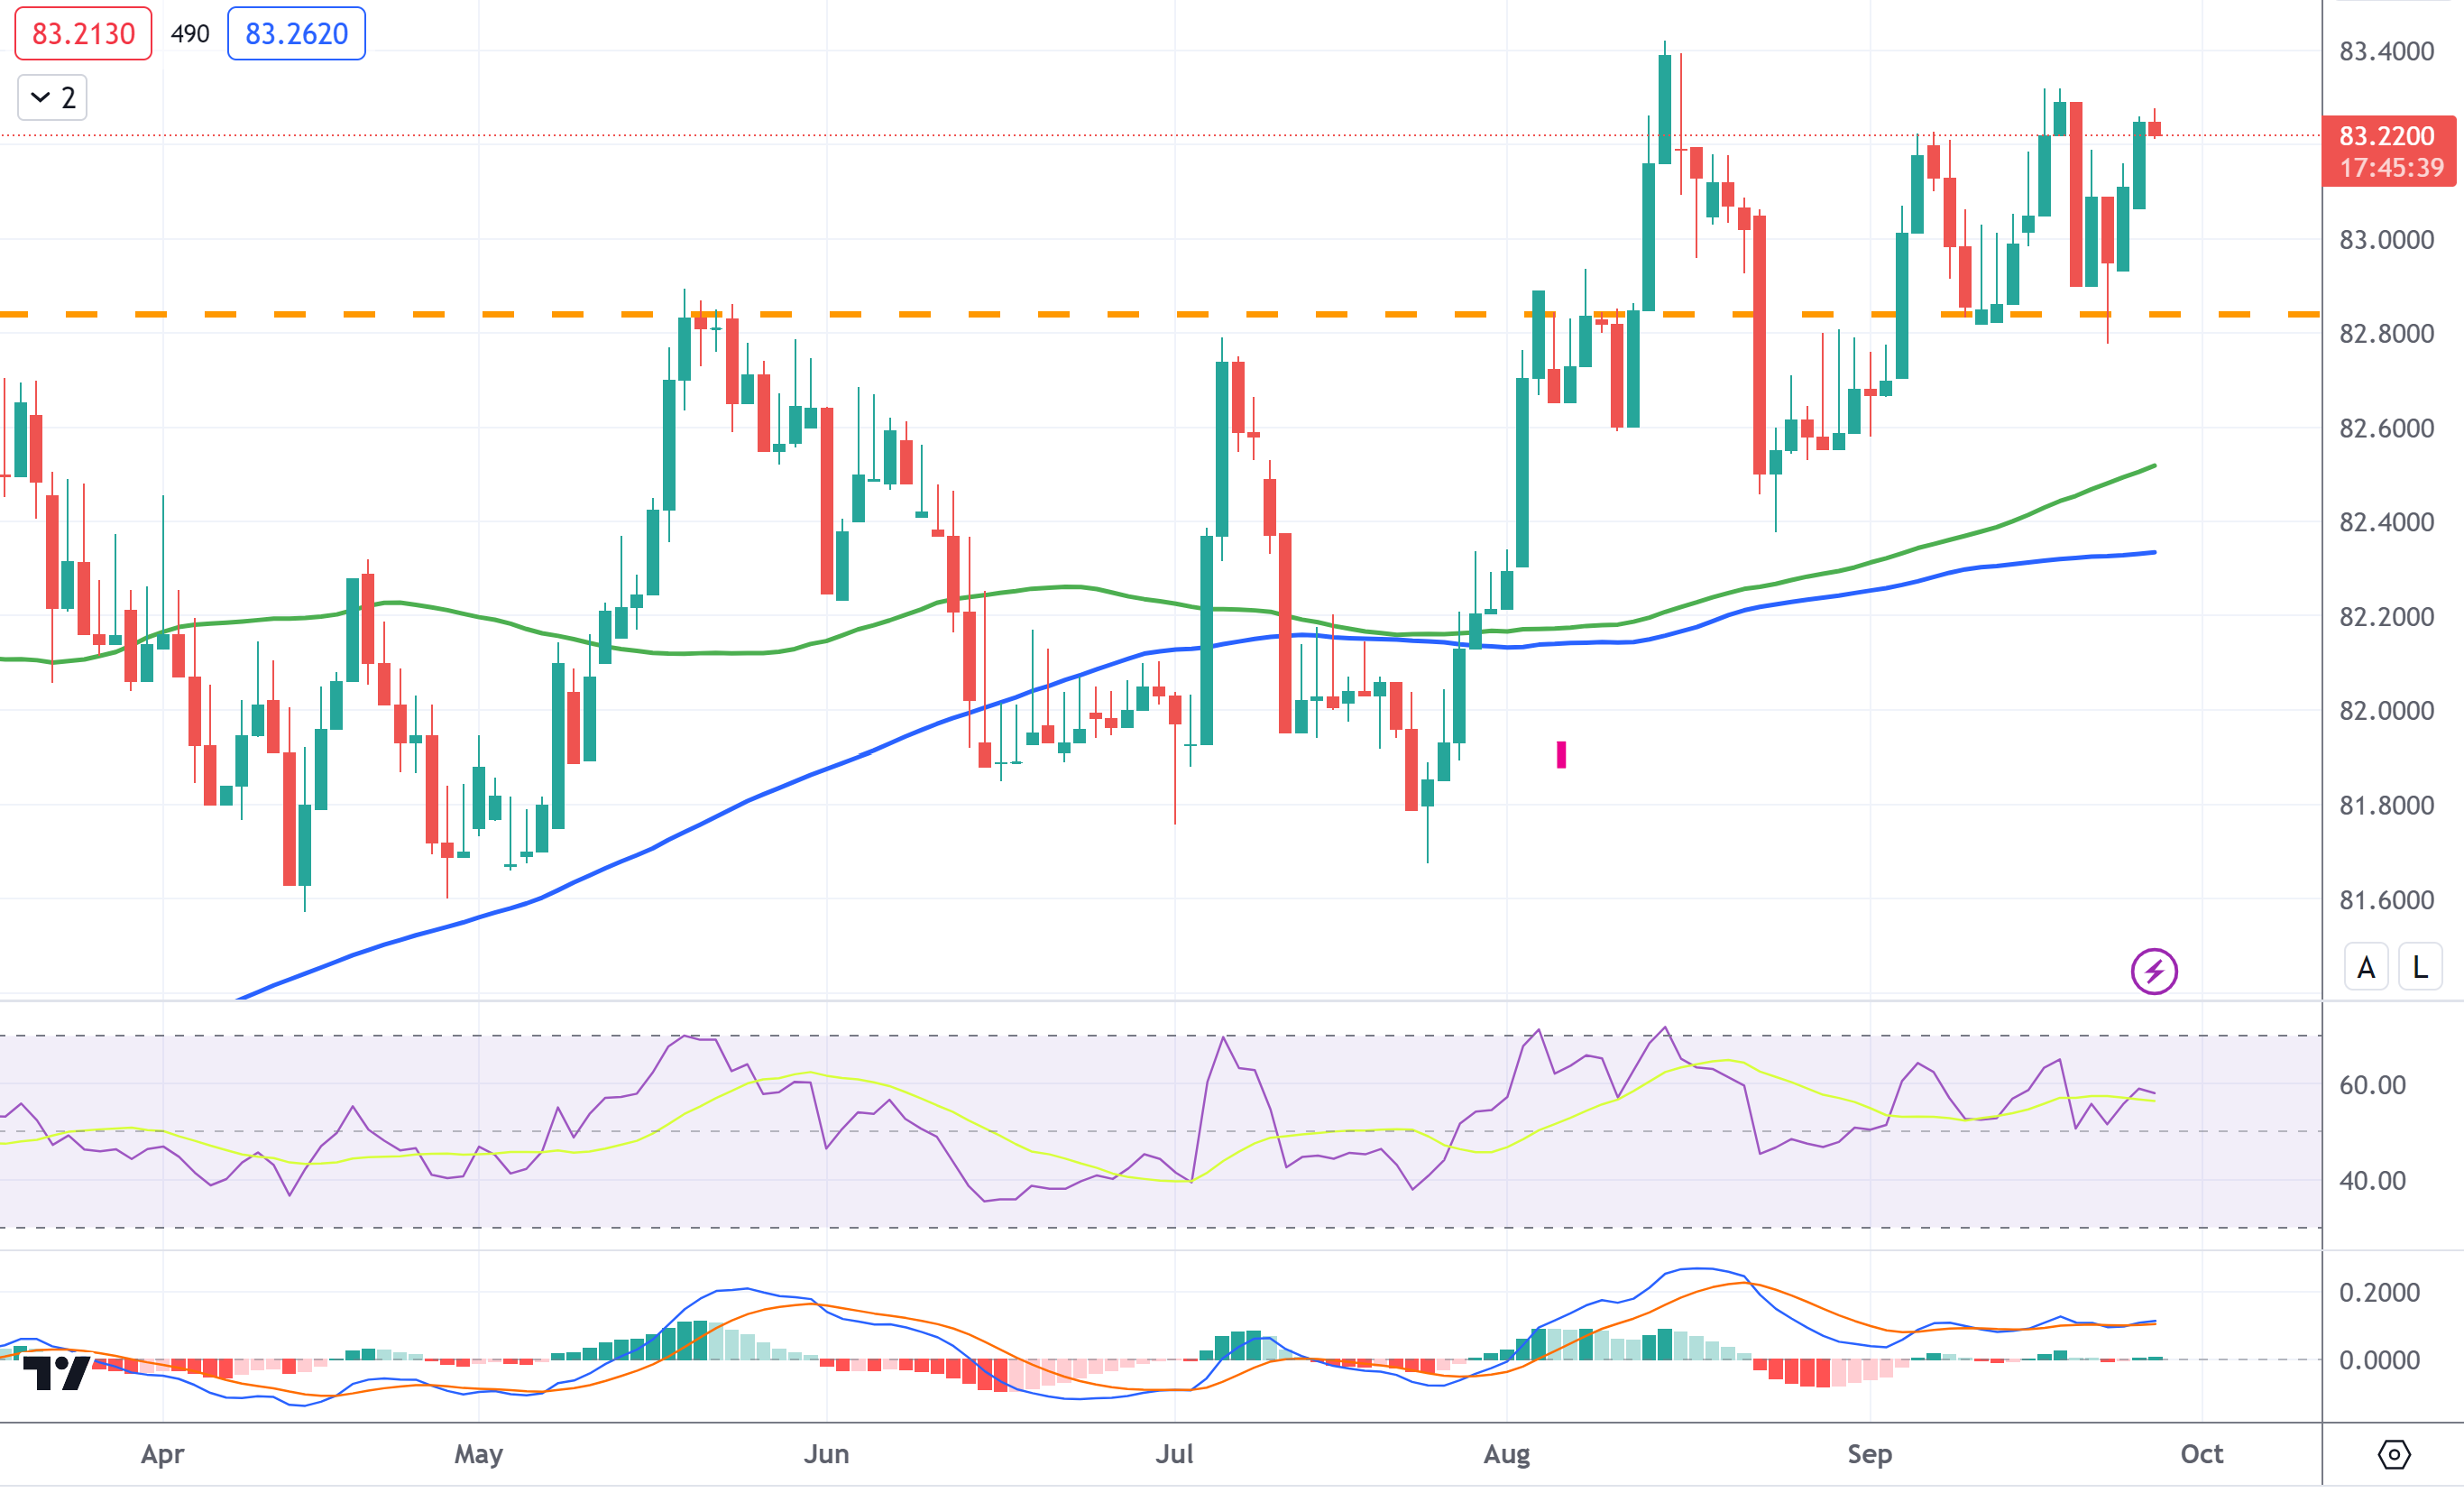
From a technical perspective, spot prices are holding comfortably above technically significant 100-day and 200-day Simple Moving Averages (SMAs). Furthermore, oscillators on the daily chart have just started moving in the positive territory and favour bullish traders. That said, it will still be prudent to wait for some follow-through buying before positioning for further gains.

The USD/INR pair might then aim to surpass the all-time peak, around the 82.83.40-83.45 region touched on August 15, and conquer the 84.00 round-figure mark.

On the flip side, any corrective decline might now find support near the 83.00 mark ahead of last Friday's swing low, around the 82.80-82.75 zone. This is closely followed by the upward-sloping 100-day SMA, near the mid-82.00s, and the 200-day SMA, around the 82.35 region. A convincing break below the latter will shift the bias in favour of bears and make the USD/INR pair vulnerable.

Spot prices might then accelerate the downward trajectory towards the 82.00 mark before eventually dropping to the July swing low, around the 81.70-81.65 region.

USD/INR daily chart

Technical levels to watch

USD/INR

Overview
Today last price83.2365
Today Daily Change-0.1823
Today Daily Change %-0.22
Today daily open83.4188
 
Trends
Daily SMA2083.0507
Daily SMA5082.8091
Daily SMA10082.5598
Daily SMA20082.3675
 
Levels
Previous Daily High83.4279
Previous Daily Low82.8855
Previous Weekly High83.8456
Previous Weekly Low82.5125
Previous Monthly High83.5505
Previous Monthly Low82.224
Daily Fibonacci 38.2%83.2207
Daily Fibonacci 61.8%83.0926
Daily Pivot Point S183.0602
Daily Pivot Point S282.7016
Daily Pivot Point S382.5178
Daily Pivot Point R183.6026
Daily Pivot Point R283.7864
Daily Pivot Point R384.145

Author

Haresh Menghani

Haresh Menghani is a detail-oriented professional with 10+ years of extensive experience in analysing the global financial markets.

More from Haresh Menghani
Share:

Markets move fast. We move first.

Orange Juice Newsletter brings you expert driven insights - not headlines. Every day on your inbox.

By subscribing you agree to our Terms and conditions.

Editor's Picks

EUR/USD holds around 1.1750 after weak German and EU PMI data

EUR/USD maintains its range trade at around 1.1750 in European trading on Tuesday. Weaker-than-expected December PMI data from Germany and the Eurozone make it difficult for the Euro to find demand, while investors refrain from taking large USD positions ahead of key employment data.

GBP/USD climbs above 1.3400 after upbeat UK PMI data

GBP/USD gains traction and trades in positive territory above 1.3400 on Tuesday as the British Pound benefits from upbeat PMI data. Later in the day, crucial data releases from the US, including Nonfarm Payrolls, Retail Sales and PMI, could trigger the next big action in the pair.

Gold retreats from seven week highs on profit-taking; all eyes on US NFP release

Gold price loses momentum below $4,300 during the early European trading hours on Tuesday, pressured by some profit-taking and weak long liquidation from the shorter-term futures traders. Furthermore, optimism around Ukraine peace talks could weigh on the safe-haven asset like Gold.

US Nonfarm Payrolls expected to point to cooling labor market in November

The United States Bureau of Labor Statistics will release the delayed Nonfarm Payrolls (NFP) data for October and November on Tuesday at 13:30 GMT. Economists expect Nonfarm Payrolls to rise by 40,000 in November. The Unemployment Rate is likely to remain unchanged at 4.4% during the same period.

NFP preview: Complex data release will determine if Fed was right to cut rates

The long wait is over, and the Bureau of Labor Statistics in the US will release nonfarm payrolls reports for both November and October at 1330 GMT on Tuesday. The overall NFP figure for October is expected to be -10k, however, it is expected to be influenced by a massive 130k drop in federal department workers. 

BNB Price Forecast: BNB slips below $855 as bearish on-chain signals and momentum indicators turn negative

BNB, formerly known as Binance Coin, continues to trade down around $855 at the time of writing on Tuesday, after a slight decline the previous day. Bearish sentiment further strengthens as BNB’s on-chain and derivatives data show rising retail activity.