|

USD/INR Price Analysis: Indian Rupee recovery hinges on clear break of 81.80

  • USD/INR bears keep the reins at weekly low despite recent inaction.
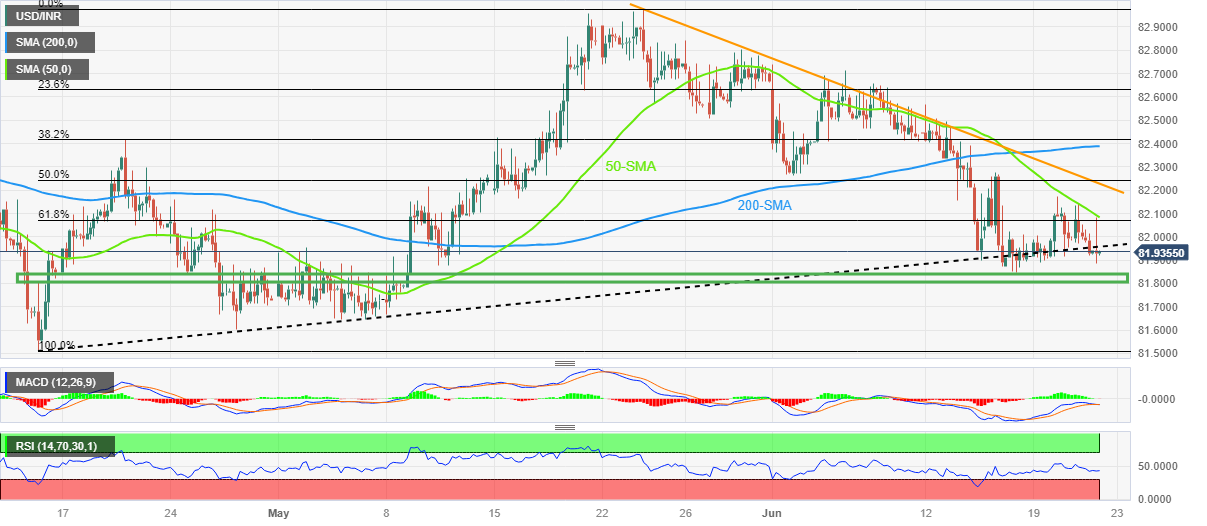
  • 10-week-old ascending support line, horizontal support zone challenge Indian Rupee bulls.
  • Key SMAs, descending trend line from late May restrict immediate upside.
  • Oscillators suggest limited downside room and highlight previous monthly lows.

USD/INR bears flirt with the short-term key supports around 81.90 amid the sluggish Asian session during early Thursday, mainly due to China’s holiday and cautious mood ahead of the key central bank announcements.

In doing so, the Indian Rupee (INR) pair holds onto the early-week U-turn from the 50-SMA amid the looming bear cross on the MACD.

It’s worth noting, however, that the below 50.0 RSI (14) line suggests bottom-picking of the USD/INR pair and hence highlight the ascending support line from April 14, as well as a 2.5-month-old horizontal support zone, respectively near 81.95 and around 81.85-80.

Hence, the USD/INR bears need validation from 81.80 to tighten the grip. Following that, the lows marked in May and April, close to 81.65 and 81.50 in that order, will be in the spotlight ahead of the yearly bottom of 80.88 marked in January.

On the flip side, USD/INR rebound needs validation from the 50-SMA hurdle of 82.10 to convince intraday buyers.

Even so, a downward-sloping trend line from late May and the 200-SMA can challenge the Indian Rupee sellers near 82.25 and 82.40.

Overall, USD/INR remains on the bear’s radar unless crossing 82.40 but the downside room appears limited.

USD/INR: Four-hour chart

Trend: Limited downside expected

Additional important levels

Overview
Today last price81.9305
Today Daily Change-0.0065
Today Daily Change %-0.01%
Today daily open81.937
 
Trends
Daily SMA2082.3485
Daily SMA5082.2039
Daily SMA10082.2919
Daily SMA20082.088
 
Levels
Previous Daily High82.1439
Previous Daily Low81.9185
Previous Weekly High82.568
Previous Weekly Low81.8477
Previous Monthly High82.981
Previous Monthly Low81.6435
Daily Fibonacci 38.2%82.0046
Daily Fibonacci 61.8%82.0578
Daily Pivot Point S181.8557
Daily Pivot Point S281.7743
Daily Pivot Point S381.6302
Daily Pivot Point R182.0811
Daily Pivot Point R282.2252
Daily Pivot Point R382.3066

Author

Anil Panchal

Anil Panchal

FXStreet

Anil Panchal has nearly 15 years of experience in tracking financial markets. With a keen interest in macroeconomics, Anil aptly tracks global news/updates and stays well-informed about the global financial moves and their implications.

More from Anil Panchal
Share:

Markets move fast. We move first.

Orange Juice Newsletter brings you expert driven insights - not headlines. Every day on your inbox.

By subscribing you agree to our Terms and conditions.

Editor's Picks

EUR/USD holds steady near 1.1750 on first trading day of 2026

EUR/USD stays calm on Friday and trades in a narrow channel at around 1.1750 as trading conditions remain thin following the New Year holiday and ahead of the weekend. The economic calendar will not feature any high-impact data releases.

GBP/USD struggles to gain traction, stabilizes above 1.3450

After testing 1.3400 on the last day of 2025, GBP/USD managed to stage a rebound. Nevertheless, the pair finds it difficult to gather momentum and moves sideways above 1.3450 as market participants remain in holiday mood.

Gold climbs toward $4,400 following deep correction

Gold reverses its direction and advances toward $4,400 after suffering heavy losses amid profit-taking before the New Year holiday. Growing expectations for a dovish Fed policy and persistent geopolitical risks seem to be helping XAU/USD stretch higher.

Cardano gains early New Year momentum, bulls target falling wedge breakout

Cardano kicks off the New Year on a positive note and is extending gains, trading above $0.36 at the time of writing on Friday. Improving on-chain and derivatives data point to growing bullish interest, while the technical outlook keeps an upside breakout in focus.

Economic outlook 2026-2027 in advanced countries: Solidity test

After a year marked by global economic resilience and ending on a note of optimism, 2026 looks promising and could be a year of solid economic performance. In our baseline scenario, we expect most of the supportive factors at work in 2025 to continue to play a role in 2026.

Crypto market outlook for 2026

Year 2025 was volatile, as crypto often is.  Among positive catalysts were favourable regulatory changes in the U.S., rise of Digital Asset Treasuries (DAT), adoption of AI and tokenization of Real-World-Assets (RWA).