|

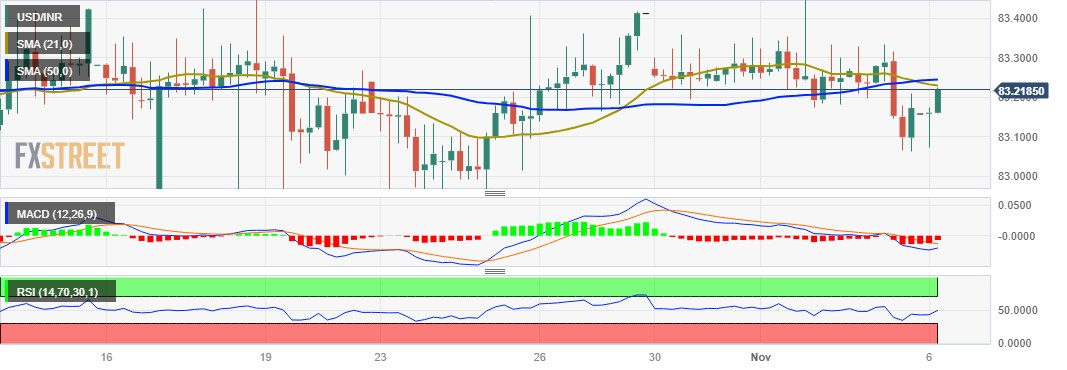
USD/INR Price Analysis: Hovers near 83.20 lined up with key barrier at 21-day SMA

  • USD/INR snaps the three-day losing streak.
  • 21-day SMA at 83.22 acts as the immediate barrier.
  • MACD indicator suggests a bearish trend in the market sentiment.

USD/INR trades higher around 83.20 lined up with immediate resistance near the 21-day Simple Moving Average (SMA) at 83.22. The USD/INR pair could gain more profits in the short term as the 50-day SMA lies slightly above the latter at 83.24.

The USD/INR pair bounces back from the recent losses incurred in the previous session, particularly after the release of disappointing US Non-Farm Payrolls data on Friday. The US Bureau of Labor Statistics revealed the October data, indicating a count of 150K, falling short of the anticipated 180K and marking a significant decline from September's 297K.

On the downside, the USD/INR pair could find key support at 83.00 psychological level aligned with October’s low at 82.97.

The Moving Average Convergence Divergence (MACD) line lies below the centerline and shows convergence occurring below the signal line. This configuration typically suggests a bearish trend, indicating potential downward momentum in the USD/INR pair.

The 14-day Relative Strength Index (RSI) hovering around the 50 level indicates that there is no strong bias towards either overbought or oversold conditions, and the market is in a state of equilibrium.

USD/INR: Four-Hour Chart

USD/INR: other levels to watch

Overview
Today last price83.1995
Today Daily Change0.0269
Today Daily Change %0.03
Today daily open83.1726
 
Trends
Daily SMA2083.2613
Daily SMA5083.1568
Daily SMA10082.7904
Daily SMA20082.5371
 
Levels
Previous Daily High83.333
Previous Daily Low83.0635
Previous Weekly High85.2015
Previous Weekly Low83.0635
Previous Monthly High84.7045
Previous Monthly Low81.2125
Daily Fibonacci 38.2%83.1664
Daily Fibonacci 61.8%83.2301
Daily Pivot Point S183.0464
Daily Pivot Point S282.9202
Daily Pivot Point S382.7769
Daily Pivot Point R183.3159
Daily Pivot Point R283.4592
Daily Pivot Point R383.5854

Author

Akhtar Faruqui

Akhtar Faruqui is a Forex Analyst based in New Delhi, India. With a keen eye for market trends and a passion for dissecting complex financial dynamics, he is dedicated to delivering accurate and insightful Forex news and analysis.

More from Akhtar Faruqui
Share:

Markets move fast. We move first.

Orange Juice Newsletter brings you expert driven insights - not headlines. Every day on your inbox.

By subscribing you agree to our Terms and conditions.

Editor's Picks

EUR/USD climbs toward 1.1800 on broad USD weakness

EUR/USD gathers bullish momentum and advances toward 1.1800 in the second half of the day on Tuesday. The US Dollar weakens and helps the pair stretch higher after the employment report showed that Nonfarm Payrolls declined by 105,000 in October before rising by 64,000 in November.

GBP/USD climbs to fresh two-month high above 1.3400

GBP/USD gains traction in the American session and trades at its highest level since mid-October above 1.3430. The British Pound benefits from upbeat PMI data, while the US Dollar struggles to find demand following the mixed employment figures and weaker-than-forecast PMI prints, allowing the pair to march north.

Gold extends its consolidative phase around $4,300

Gold trades in positive above $4,300 after spending the first half of the day under bearish pressure. XAU/USD capitalizes on renewed USD weakness after the jobs report showed that the Unemployment Rate climbed to 4.6% in November and the PMI data revealed a loss of growth momentum in the private sector in December. 

US Retail Sales virtually unchanged at $732.6 billion in October

Retail Sales in the United States were virtually unchanged at $732.6 billion in October, the US Census Bureau reported on Tuesday. This print followed the 0.1% increase (revised from 0.3%) recorded in September and came in below the market expectation of +0.1%.

Ukraine-Russia in the spotlight once again

Since the start of the week, gold’s price has moved lower, but has yet to erase the gains made last week. In today’s report we intend to focus on the newest round of peace talks between Russia and Ukraine, whilst noting the release of the US Employment data later on day and end our report with an update in regards to the tensions brewing in Venezuela.

BNB Price Forecast: BNB slips below $855 as bearish on-chain signals and momentum indicators turn negative

BNB, formerly known as Binance Coin, continues to trade down around $855 at the time of writing on Tuesday, after a slight decline the previous day. Bearish sentiment further strengthens as BNB’s on-chain and derivatives data show rising retail activity.