USD/INR Price Analysis: Double top, RSI divergence tease Indian rupee buyers below 78.00


  • USD/INR again slips after refreshing all-time high, renews daily low of late.
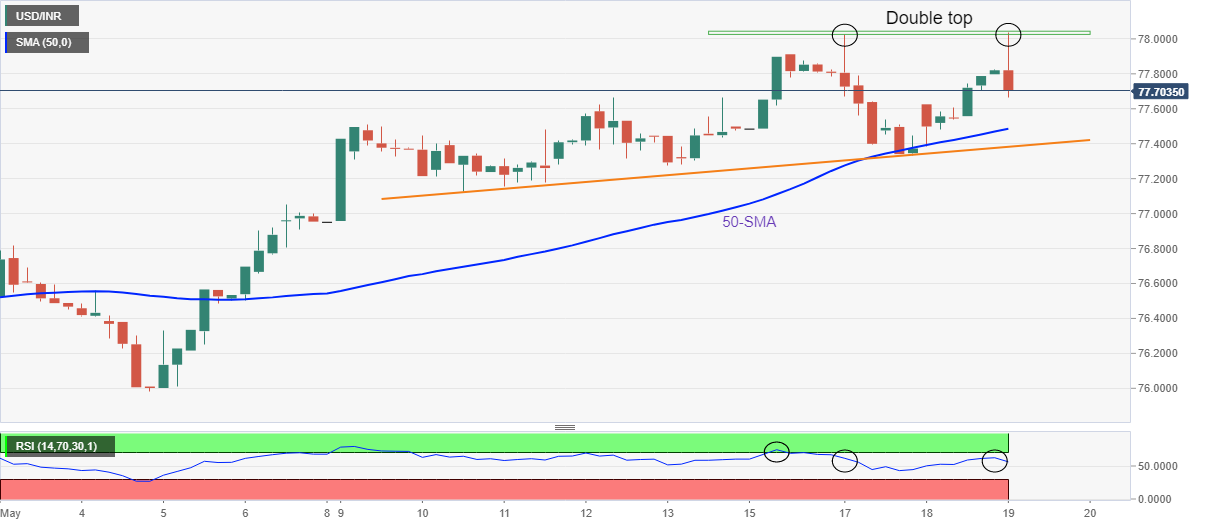
  • Bearish RSI divergence hints at further declines but “Double Top” confirmation needed to convince sellers.
  • 50-SMA, weekly support line act as extra downside filters.

USD/INR takes offers to renew intraday low around 77.65, after refreshing the all-time peak with 78.03 earlier in the day, as the US dollar struggles to keep recent gains amid cautious optimism.

In doing so, the Indian rupee (INR) pair portrays a “Double Top” bearish chart pattern on the four-hour play during early Thursday morning in Europe.

Not only the “Double Top” but bearish RSI divergence, identified when RSI prints lower-high even if prices make higher-high, also keep USD/INR bears hopeful.

However, a clear downside break of the latest low near 77.33 becomes necessary to confirm the bearish chart formation.

Ahead of that, the 50-SMA and a one-week-old rising trend line, respectively around 77.48 and 77.38, challenge the USD/INR pair sellers.

Meanwhile, recovery moves need a clear run-up beyond the 78.00 threshold, also crossing the latest high of 78.03, to reject the bearish chart formation.

It’s worth noting that the RSI should also accompany the jump in the prices to direct USD/INR bulls toward the 80.00 psychological magnet.

USD/INR: Four-hour chart

Trend: Pullback expected

Additional important levels

Overview
Today last price 77.5567
Today Daily Change 0.2052
Today Daily Change % 0.27%
Today daily open 77.3515
 
Trends
Daily SMA20 76.8245
Daily SMA50 76.3934
Daily SMA100 75.637
Daily SMA200 75.0826
 
Levels
Previous Daily High 78.0232
Previous Daily Low 77.335
Previous Weekly High 77.665
Previous Weekly Low 76.9531
Previous Monthly High 77.0715
Previous Monthly Low 75.2634
Daily Fibonacci 38.2% 77.5979
Daily Fibonacci 61.8% 77.7603
Daily Pivot Point S1 77.1166
Daily Pivot Point S2 76.8817
Daily Pivot Point S3 76.4285
Daily Pivot Point R1 77.8048
Daily Pivot Point R2 78.258
Daily Pivot Point R3 78.4929


Share: Feed news

Information on these pages contains forward-looking statements that involve risks and uncertainties. Markets and instruments profiled on this page are for informational purposes only and should not in any way come across as a recommendation to buy or sell in these assets. You should do your own thorough research before making any investment decisions. FXStreet does not in any way guarantee that this information is free from mistakes, errors, or material misstatements. It also does not guarantee that this information is of a timely nature. Investing in Open Markets involves a great deal of risk, including the loss of all or a portion of your investment, as well as emotional distress. All risks, losses and costs associated with investing, including total loss of principal, are your responsibility. The views and opinions expressed in this article are those of the authors and do not necessarily reflect the official policy or position of FXStreet nor its advertisers. The author will not be held responsible for information that is found at the end of links posted on this page.

If not otherwise explicitly mentioned in the body of the article, at the time of writing, the author has no position in any stock mentioned in this article and no business relationship with any company mentioned. The author has not received compensation for writing this article, other than from FXStreet.

FXStreet and the author do not provide personalized recommendations. The author makes no representations as to the accuracy, completeness, or suitability of this information. FXStreet and the author will not be liable for any errors, omissions or any losses, injuries or damages arising from this information and its display or use. Errors and omissions excepted.

The author and FXStreet are not registered investment advisors and nothing in this article is intended to be investment advice.

Recommended content


Recommended content

Editors’ Picks

EUR/USD climbs to 10-day highs above 1.0700

EUR/USD climbs to 10-day highs above 1.0700

EUR/USD gained traction and rose to its highest level in over a week above 1.0700 in the American session on Tuesday. The renewed US Dollar weakness following the disappointing PMI data helps the pair stretch higher.

EUR/USD News

GBP/USD extends recovery beyond 1.2400 on broad USD weakness

GBP/USD extends recovery beyond 1.2400 on broad USD weakness

GBP/USD gathered bullish momentum and extended its daily rebound toward 1.2450 in the second half of the day. The US Dollar came under heavy selling pressure after weaker-than-forecast PMI data and fueled the pair's rally. 

GBP/USD News

Gold rebounds to $2,320 as US yields turn south

Gold rebounds to $2,320 as US yields turn south

Gold reversed its direction and rose to the $2,320 area, erasing a large portion of its daily losses in the process. The benchmark 10-year US Treasury bond yield stays in the red below 4.6% following the weak US PMI data and supports XAU/USD.

Gold News

Here’s why Ondo price hit new ATH amid bearish market outlook Premium

Here’s why Ondo price hit new ATH amid bearish market outlook

Ondo price shows no signs of slowing down after setting up an all-time high (ATH) at $1.05 on March 31. This development is likely to be followed by a correction and ATH but not necessarily in that order.

Read more

Germany’s economic come back

Germany’s economic come back

Germany is the sick man of Europe no more. Thanks to its service sector, it now appears that it will exit recession, and the economic future could be bright. The PMI data for April surprised on the upside for Germany, led by the service sector.

Read more

Forex MAJORS

Cryptocurrencies

Signatures