USD/INR Price Analysis: Bear flag keeps Indian rupee buyers hopeful, 74.45 eyed


Share:
  • USD/INR defends corrective latest pullback around seven-week low.
  • Bearish chart pattern needs validation from 20-SMA, buyers need to conquer 200-SMA for conviction.

USD/INR seesaws around 74.55-60 during Wednesday’s Asian session, after rising the most in three weeks the previous day. In doing so, the Indian rupee (INR) pair holds onto the recovery moves from the lowest levels since mid-November, flashed on Friday.

Even so, a bearish chart pattern called flag challenges USD/INR buyers on the four-hour (4H) play.

The quote’s latest rebound, however, takes clues from ascending RSI line and hints at another attempt to cross the 50-SMA level of 74.65.

Following that, the flag’s upper line, around 74.75, will precede the 75.00 threshold to challenge the USD/INR bulls. Also acting as the key upside hurdle is the 200-SMA level of 75.15.

On the flip side, 20-SMA adds strength to the bearish formation’s support line near 74.65, a break of which will theoretically confirm the south-run towards the last year’s bottom surrounding 72.20-15.

During the anticipated fall, lows marked in November and September 2021, respectively around 73.85 and 72.90, may offer a breather space to the USD/INR bears.

USD/INR: Four-hour chart
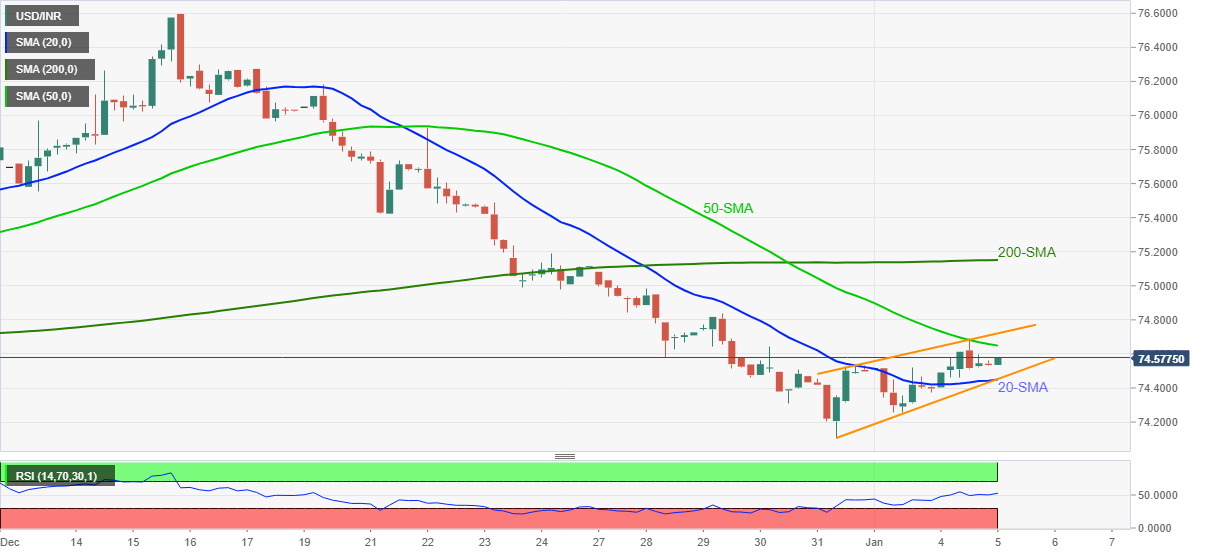
Trend: Bearish

Additional important levels

Overview
Today last price 74.5775
Today Daily Change 0.0213
Today Daily Change % 0.03%
Today daily open 74.5562
 
Trends
Daily SMA20 75.3198
Daily SMA50 74.9153
Daily SMA100 74.5408
Daily SMA200 74.2723
 
Levels
Previous Daily High 74.6888
Previous Daily Low 74.3752
Previous Weekly High 75.082
Previous Weekly Low 74.1065
Previous Monthly High 76.5958
Previous Monthly Low 74.1065
Daily Fibonacci 38.2% 74.569
Daily Fibonacci 61.8% 74.495
Daily Pivot Point S1 74.3913
Daily Pivot Point S2 74.2264
Daily Pivot Point S3 74.0776
Daily Pivot Point R1 74.7049
Daily Pivot Point R2 74.8537
Daily Pivot Point R3 75.0186


Share: Feed news

Information on these pages contains forward-looking statements that involve risks and uncertainties. Markets and instruments profiled on this page are for informational purposes only and should not in any way come across as a recommendation to buy or sell in these assets. You should do your own thorough research before making any investment decisions. FXStreet does not in any way guarantee that this information is free from mistakes, errors, or material misstatements. It also does not guarantee that this information is of a timely nature. Investing in Open Markets involves a great deal of risk, including the loss of all or a portion of your investment, as well as emotional distress. All risks, losses and costs associated with investing, including total loss of principal, are your responsibility. The views and opinions expressed in this article are those of the authors and do not necessarily reflect the official policy or position of FXStreet nor its advertisers. The author will not be held responsible for information that is found at the end of links posted on this page.

If not otherwise explicitly mentioned in the body of the article, at the time of writing, the author has no position in any stock mentioned in this article and no business relationship with any company mentioned. The author has not received compensation for writing this article, other than from FXStreet.

FXStreet and the author do not provide personalized recommendations. The author makes no representations as to the accuracy, completeness, or suitability of this information. FXStreet and the author will not be liable for any errors, omissions or any losses, injuries or damages arising from this information and its display or use. Errors and omissions excepted.

The author and FXStreet are not registered investment advisors and nothing in this article is intended to be investment advice.

Follow us on Telegram

Stay updated of all the news

Join Telegram

Recommended content


Follow us on Telegram

Stay updated of all the news

Join Telegram

Recommended content

Editors’ Picks

EUR/USD drops toward 1.0700 after US jobs report

EUR/USD drops toward 1.0700 after US jobs report

EUR/USD came under renewed bearish pressure in the second half of the day on Friday and declined toward 1.0700. Stronger-than-expected Nonfarm Payrolls (NFP) data helps the US Dollar gather strength ahead of the weekend and forces the pair to stay on the back foot.

EUR/USD News

GBP/USD extends slide below 1.2450 amid a stronger USD

GBP/USD extends slide below 1.2450 amid a stronger USD

GBP/USD dropped further and hit fresh daily lows below 1.2450 amid a stronger US dollar. The Greenback remains firm following the release of the US May jobs report. Despite losing almost 100 pips on Friday, GBP/USD is still on track for a weekly gain.

GBP/USD News

Gold falls below $1,960 as US yields rebound after US jobs data

Gold falls below $1,960 as US yields rebound after US jobs data

Gold price turned south and declined below $1,960 on Friday. After the data from the US revealed that Nonfarm Payrolls rose 339,000 in May, the benchmark 10-year US Treasury bond yield gained more than 2% and recovered toward 3.7%, weighing heavily on XAU/USD.

Gold News

China crypto community picks Ethereum, Arbitrum and BNB Chain as top protocols

China crypto community picks Ethereum, Arbitrum and BNB Chain as top protocols

Ethereum, Arbitrum and BNB Chain protocols are top picks for the Chinese crypto community, data from a report shows, a possible bullish catalyst for tokens related to these protocols as Hong Kong opens the door of crypto to retail investors.

Read more

LULU stock adds 15% on big Wall Street beat

LULU stock adds 15% on big Wall Street beat

Lululemon Athletica did it again. In something that has become quite predictable, LULU stock sailed 14.9% higher in Friday’s premarket to $377.20 after the prized athleisure brand posted a nearly 15% earnings beat for the first quarter.

Read more

Forex MAJORS

Cryptocurrencies

Signatures