USD/INR trades firmly while US Senate approves bill to end shutdown
- The Indian Rupee trades in a tight range around 88.80 against the US Dollar at the start of the week.
- FIIs turned out to be net buyers in the Indian stock market on Friday.
- Investors await India’s CPI data for October, which will be released on Friday.
The Indian Rupee (INR) trades flat against the US Dollar (USD) on Monday, with the USD/INR pair consolidating around 88.80. The pair wobbles as the US Dollar (USD) trades calmly amid the passage of the first vote favoring the United States (US) government reopening after an almost 40-day-long shutdown.
At the press time, the US Dollar Index (DXY), which tracks the Greenback’s value against six major currencies, wobbles around 99.65.
The report from CNN showed that the new US stopgap bill will extend government funding until January in exchange for the reversal of lay-offs announced during the shutdown.
Earlier in the day, the expectations of an end to the historically longest US federal shutdown were prompted by comments from President Donald Trump while responding to reporters at the White House. "It looks like we’re getting very close to the shutdown. We never agreed to give any substantial money, or any money to prisoners, illegals that come into our country, and I think that the Democrats understand that; and it looks like we’re getting close to the shutdown ending. You’ll know it very soon,” CNN reported.
Investors await India's retail inflation data for October
- The Indian Rupee trades higher against its major peers on Monday after a decent amount of investment by overseas investors in the Indian stock market on Friday. Foreign Institutional Investors (FIIs) bought shares worth Rs. 4,581.34 crore on Friday after remaining net sellers in the remaining trading days of the last week.
- FIIs turning net buyers on Friday came as a surprise amid the absence of fresh trade talks between the US and India. Foreign investors have maintained distance from the Indian equity market in the past few months as Washington and New Delhi have yet to reach a consensus, a scenario that has dampened the competitiveness of Indian products in the global market.
- This week, the major highlight for the Indian Rupee will be the Consumer Price Index (CPI) data for October, which will be published on Wednesday. India’s retail inflation is expected to have grown 0.48% on an annualized basis, slower than the 1.54% growth seen in September. The expectations of a soft CPI figure are driven by a sustained fall in food prices.
- According to analysts at Bank of America (BofA), “Base effects are most supportive in this month, as it mirrors the sharp increase in vegetable prices we had seen in October last year”.
- Signs of price pressures cooling would boost expectations of further monetary policy easing by the Reserve Bank of India (RBI) this year. So far, this year, the RBI has already reduced its Repo Rate by 100 basis points (bps) to 5.5%.
The table below shows the percentage change of Indian Rupee (INR) against listed major currencies today. Indian Rupee was the strongest against the Japanese Yen.
| USD | EUR | GBP | JPY | CAD | AUD | INR | CHF | |
|---|---|---|---|---|---|---|---|---|
| USD | 0.03% | 0.09% | 0.43% | -0.05% | -0.47% | 0.00% | 0.15% | |
| EUR | -0.03% | 0.05% | 0.39% | -0.09% | -0.50% | -0.02% | 0.12% | |
| GBP | -0.09% | -0.05% | 0.36% | -0.14% | -0.56% | -0.08% | 0.06% | |
| JPY | -0.43% | -0.39% | -0.36% | -0.47% | -0.90% | -0.43% | -0.28% | |
| CAD | 0.05% | 0.09% | 0.14% | 0.47% | -0.43% | 0.06% | 0.20% | |
| AUD | 0.47% | 0.50% | 0.56% | 0.90% | 0.43% | 0.49% | 0.63% | |
| INR | -0.01% | 0.02% | 0.08% | 0.43% | -0.06% | -0.49% | 0.14% | |
| CHF | -0.15% | -0.12% | -0.06% | 0.28% | -0.20% | -0.63% | -0.14% |
The heat map shows percentage changes of major currencies against each other. The base currency is picked from the left column, while the quote currency is picked from the top row. For example, if you pick the Indian Rupee from the left column and move along the horizontal line to the US Dollar, the percentage change displayed in the box will represent INR (base)/USD (quote).
Technical Analysis: USD/INR holds key 20-day EMA
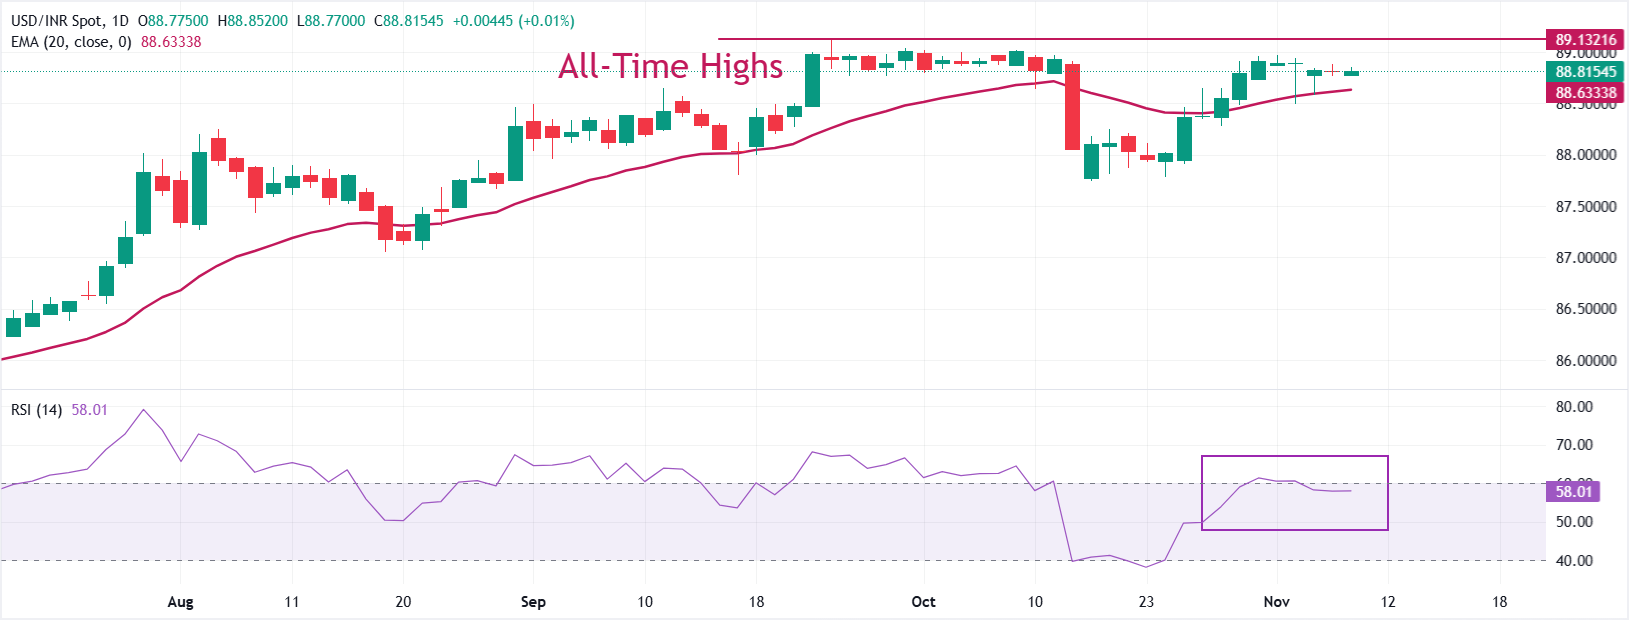
The USD/INR wobbles near 88.80 on Monday. The pair stays above the 20-day Exponential Moving Average (EMA), which trades around 88.63.
The 14-day Relative Strength Index (RSI) strives to return above 60.00. A fresh bullish momentum would emerge if the RSI (14) manages to do so.
Looking down, the August 21 low of 87.07 will act as key support for the pair. On the upside, the all-time high of 89.12 will be a key barrier.
Inflation FAQs
Inflation measures the rise in the price of a representative basket of goods and services. Headline inflation is usually expressed as a percentage change on a month-on-month (MoM) and year-on-year (YoY) basis. Core inflation excludes more volatile elements such as food and fuel which can fluctuate because of geopolitical and seasonal factors. Core inflation is the figure economists focus on and is the level targeted by central banks, which are mandated to keep inflation at a manageable level, usually around 2%.
The Consumer Price Index (CPI) measures the change in prices of a basket of goods and services over a period of time. It is usually expressed as a percentage change on a month-on-month (MoM) and year-on-year (YoY) basis. Core CPI is the figure targeted by central banks as it excludes volatile food and fuel inputs. When Core CPI rises above 2% it usually results in higher interest rates and vice versa when it falls below 2%. Since higher interest rates are positive for a currency, higher inflation usually results in a stronger currency. The opposite is true when inflation falls.
Although it may seem counter-intuitive, high inflation in a country pushes up the value of its currency and vice versa for lower inflation. This is because the central bank will normally raise interest rates to combat the higher inflation, which attract more global capital inflows from investors looking for a lucrative place to park their money.
Formerly, Gold was the asset investors turned to in times of high inflation because it preserved its value, and whilst investors will often still buy Gold for its safe-haven properties in times of extreme market turmoil, this is not the case most of the time. This is because when inflation is high, central banks will put up interest rates to combat it. Higher interest rates are negative for Gold because they increase the opportunity-cost of holding Gold vis-a-vis an interest-bearing asset or placing the money in a cash deposit account. On the flipside, lower inflation tends to be positive for Gold as it brings interest rates down, making the bright metal a more viable investment alternative.
Author

Sagar Dua
FXStreet
Sagar Dua is associated with the financial markets from his college days. Along with pursuing post-graduation in Commerce in 2014, he started his markets training with chart analysis.


