USD Index regains the smile and 105.00 on solid NFP


  • The index bounces off multi-month lows post-NFP.
  • The US economy added more jobs than expected in November.
  • A 50 bps rate hike remains favoured despite robust Payrolls.

The Greenback, in terms of the USD Index (DXY), quickly reclaimed the area above the 105.00 mark following another strong result for US Nonfarm Payrolls on Friday.

USD Index appears supported near 104.40

The index manages to regain strong upside traction following solid prints from November’s Payrolls, which showed both the job creation and wage growth remained far from mitigated.

Indeed, the US economy added 263K jobs during last month (vs. 200K expected) and the Unemployment Rate remained at 3.7%, while Average Hourly Earnings rose more than expected 0.6% MoM and 5.1% from a year earlier. The Participation Rate, however, deflated marginally to 62.1% (from 62.2%).

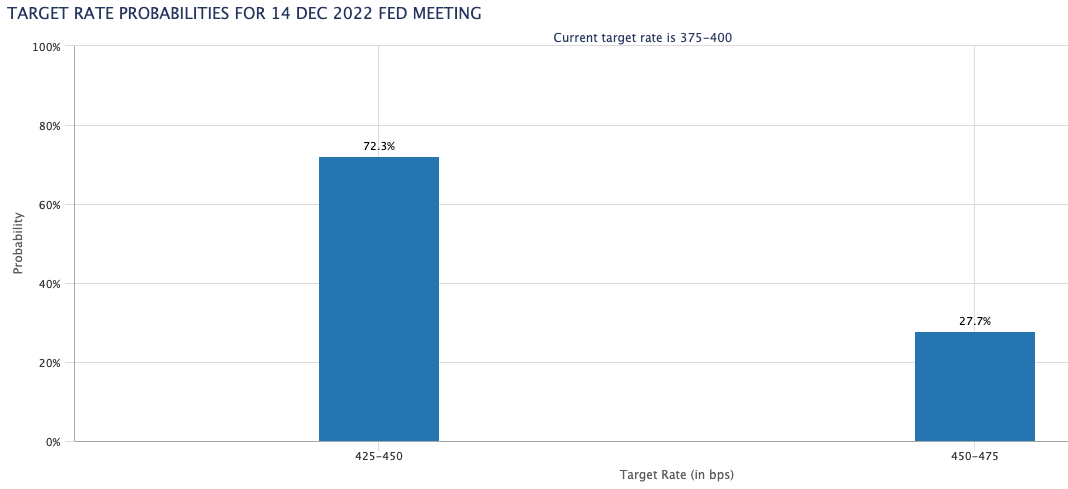
Following the release of the jobs report, the probability of a 75 bps rate hike at the next Fed’s gathering (December 14) improved to nearly 30%, according to CME Group's FedWatch Tool.

Next on tap in the US docket comes the speech by Chicago Federal Reserve President Charles Evans (2023 voter, centrist).

What to look for around USD

The US Dollar seems to have met some decent contention around 104.30 for the time being.

While hawkish Fedspeak maintains the Fed’s pivot narrative in the freezer, upcoming results in US fundamentals would likely play a key role in determining the chances of a slower pace of the Fed’s normalization process in the short term.

Key events in the US this week: Nonfarm Payrolls, Unemployment Rate (Friday).

Eminent issues on the back boiler: Hard/soft/softish? landing of the US economy. Prospects for further rate hikes by the Federal Reserve vs. speculation of a recession in the next months. Fed’s pivot. Geopolitical effervescence vs. Russia and China. US-China persistent trade conflict.

USD Index relevant levels

Now, the index is gaining 0.58% at 105.33 and faces the next up barrier at 105.55 (200-day SMA) followed by 107.19 (weekly high November 30) and then 107.99 (weekly high November 21). On the other hand, the breakdown of 104.37 (weekly low December 2) would open the door to 103.41 (weekly low June 16) and finally 101.29 (monthly low May 30).

Share: Feed news

Information on these pages contains forward-looking statements that involve risks and uncertainties. Markets and instruments profiled on this page are for informational purposes only and should not in any way come across as a recommendation to buy or sell in these assets. You should do your own thorough research before making any investment decisions. FXStreet does not in any way guarantee that this information is free from mistakes, errors, or material misstatements. It also does not guarantee that this information is of a timely nature. Investing in Open Markets involves a great deal of risk, including the loss of all or a portion of your investment, as well as emotional distress. All risks, losses and costs associated with investing, including total loss of principal, are your responsibility. The views and opinions expressed in this article are those of the authors and do not necessarily reflect the official policy or position of FXStreet nor its advertisers. The author will not be held responsible for information that is found at the end of links posted on this page.

If not otherwise explicitly mentioned in the body of the article, at the time of writing, the author has no position in any stock mentioned in this article and no business relationship with any company mentioned. The author has not received compensation for writing this article, other than from FXStreet.

FXStreet and the author do not provide personalized recommendations. The author makes no representations as to the accuracy, completeness, or suitability of this information. FXStreet and the author will not be liable for any errors, omissions or any losses, injuries or damages arising from this information and its display or use. Errors and omissions excepted.

The author and FXStreet are not registered investment advisors and nothing in this article is intended to be investment advice.

Recommended content


Recommended content

Editors’ Picks

AUD/USD remained bid above 0.6500

AUD/USD remained bid above 0.6500

AUD/USD extended further its bullish performance, advancing for the fourth session in a row on Thursday, although a sustainable breakout of the key 200-day SMA at 0.6526 still remain elusive.

AUD/USD News

EUR/USD faces a minor resistance near at 1.0750

EUR/USD faces a minor resistance near at 1.0750

EUR/USD quickly left behind Wednesday’s small downtick and resumed its uptrend north of 1.0700 the figure, always on the back of the persistent sell-off in the US Dollar ahead of key PCE data on Friday.

EUR/USD News

Gold holds around $2,330 after dismal US data

Gold holds around $2,330 after dismal US data

Gold fell below $2,320 in the early American session as US yields shot higher after the data showed a significant increase in the US GDP price deflator in Q1. With safe-haven flows dominating the markets, however, XAU/USD reversed its direction and rose above $2,340.

Gold News

Bitcoin price continues to get rejected from $65K resistance as SEC delays decision on spot BTC ETF options

Bitcoin price continues to get rejected from $65K resistance as SEC delays decision on spot BTC ETF options

Bitcoin (BTC) price has markets in disarray, provoking a broader market crash as it slumped to the $62,000 range on Thursday. Meanwhile, reverberations from spot BTC exchange-traded funds (ETFs) continue to influence the market.

Read more

US economy: slower growth with stronger inflation

US economy: slower growth with stronger inflation

The dollar strengthened, and stocks fell after statistical data from the US. The focus was on the preliminary estimate of GDP for the first quarter. Annualised quarterly growth came in at just 1.6%, down from the 2.5% and 3.4% previously forecast.

Read more

Forex MAJORS

Cryptocurrencies

Signatures