|

USD Index Price Analysis: The 200-day SMA near 103.20 holds the downside

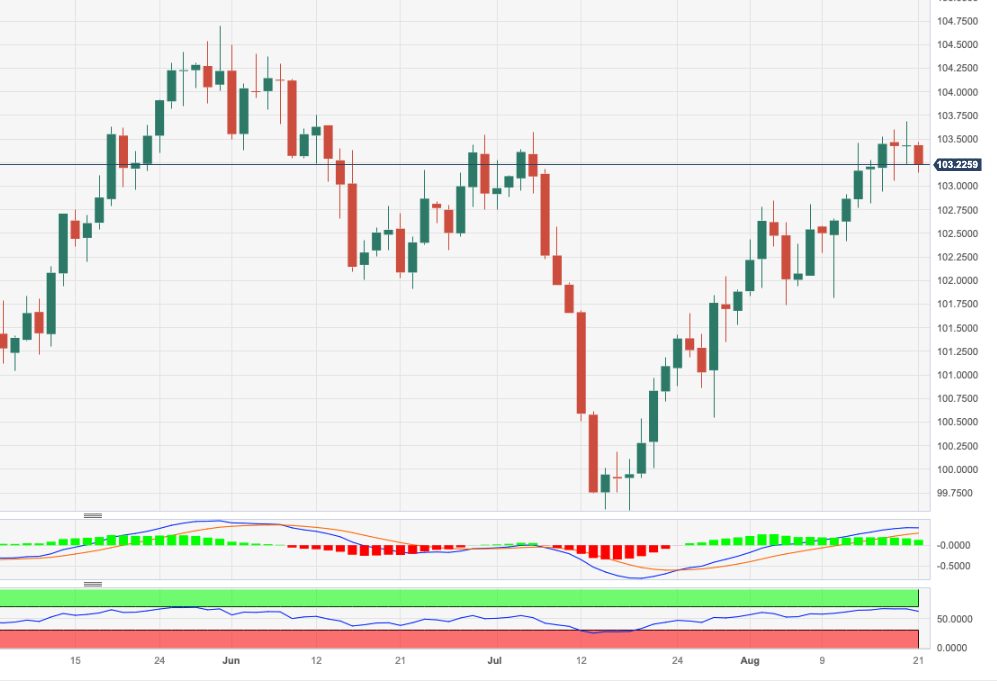
  • DXY comes under pressure after hitting fresh tops near 103.70.
  • The 200-day SMA near 103.20 underpins the index so far.

DXY faces extra selling pressure and revisits the 103.15/10 band at the beginning of the week.

In spite of Monday’s corrective move, the index maintains the bullish view well in place with the immediate hurdle now emerging at the May top of 104.69 (May 31) ahead of the 2023 peak of 105.88 (March 8).

It is worth noting that this area of monthly highs appears reinforced by the proximity of the key 200-day SMA, today at 103.18.

Looking at the broader picture, a convincing breakout of the 200-day SMA should shift the outlook for the index to a more constructive one.

DXY daily chart

Dollar Index Spot

Overview
Today last price103.24
Today Daily Change33
Today Daily Change %-0.18
Today daily open103.43
 
Trends
Daily SMA20102.38
Daily SMA50102.19
Daily SMA100102.36
Daily SMA200103.16
 
Levels
Previous Daily High103.68
Previous Daily Low103.22
Previous Weekly High103.68
Previous Weekly Low102.77
Previous Monthly High103.57
Previous Monthly Low99.57
Daily Fibonacci 38.2%103.51
Daily Fibonacci 61.8%103.4
Daily Pivot Point S1103.21
Daily Pivot Point S2102.99
Daily Pivot Point S3102.75
Daily Pivot Point R1103.67
Daily Pivot Point R2103.9
Daily Pivot Point R3104.13

Author

Pablo Piovano

Born and bred in Argentina, Pablo has been carrying on with his passion for FX markets and trading since his first college years.

More from Pablo Piovano
Share:

Markets move fast. We move first.

Orange Juice Newsletter brings you expert driven insights - not headlines. Every day on your inbox.

By subscribing you agree to our Terms and conditions.

Editor's Picks

EUR/USD corrects lower, returns to 1.1650

EUR/USD could not sustain an earlier move to fresh tops just above 1.1680 on Thursday, coming under fresh selling pressure and revisiting the mid-1.1600s in the latter part of the NA session. The pair’s correction comes in response to an acceptable bounce in the US Dollar.

GBP/USD attempts some consolidation near 1.3350

GBP/USD is alternating gains with losses near 1.3350 on Thursday. The Greenback’s attempts to recover aren't really sticking, upbeat data or not, as traders stay confident that the Fed will deliver a 25 bps rate cut at its final meeting of the year.

Gold flat lines near $4,200 ahead of US PCE inflation release

Gold price (XAU/USD) trades on a flat note near $4,205 during the early Asian trading hours on Friday. Rising US Treasury yields and upbeat US jobs data cap upside for the precious metal. Traders might prefer to wait on the sidelines ahead of the key US inflation data. The US delayed the Personal Consumption Expenditures Price Index report for September, which will be published later on Friday. 

XRP slides amid record on-chain activity, mixed technical signals

Ripple (XRP) is trading under pressure at the time of writing on Thursday, after bulls failed to break the short-term resistance at $2.22. The reversal may extend toward Monday’s low of $1.98, especially if risk-off sentiment persists in the broader cryptocurrency market.

Why the Fed may cut rates in December: Understanding the policy shift

The Fed has gone through a noticeable policy swing in recent months - from initiating a rate cut, to signaling a potential pause, and now shifting once again toward another cut in December. This has created understandable confusion among traders and investors trying to interpret the Fed’s reaction function.

XRP edges lower despite record on-chain activity and steady ETF inflows

Ripple is trading under pressure at the time of writing on Thursday, after bulls failed to break the short-term resistance at $2.22. The reversal may extend toward Monday’s low of $1.98, especially if risk-off sentiment persists in the broader cryptocurrency market.