|

USD Index Price Analysis: Extra upside should not be ruled out

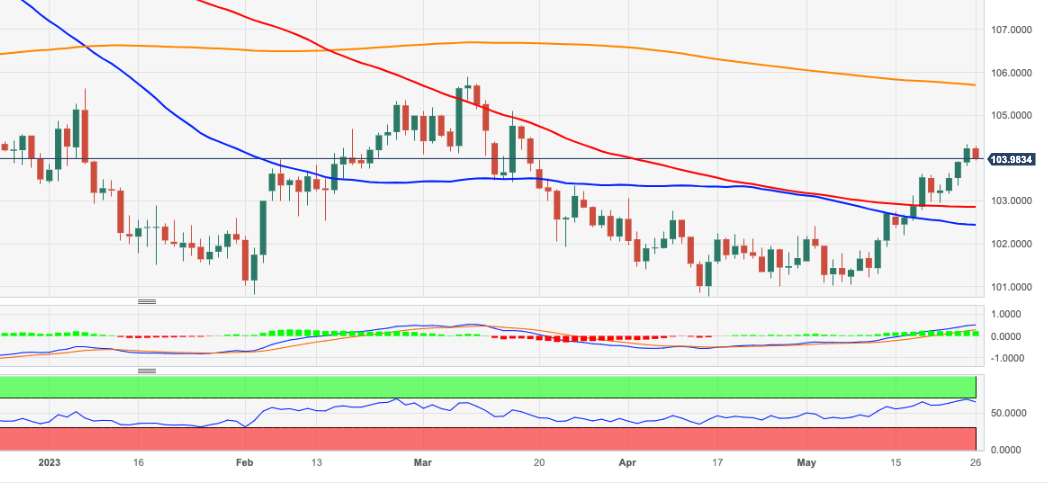
  • DXY meets some resistance around the 104.30 region so far.
  • Extra upside should face the key 200-day SMA near 105.70.

DXY retreats for the first session after four consecutive daily gains, putting the 104.00 region to the test at the end of the week.                                                                                             

Further upside appears on the cards in the near term. That said, the next resistance level of note is expected at the key 200-day SMA, today at 105.69 ahead of the 2023 top of 105.88 (March 8).

Looking at the broader picture, while below the 200-day SMA the outlook for the index is expected to remain negative.

DXY daily chart

Dollar Index Spot

Overview
Today last price103.96
Today Daily Change33
Today Daily Change %-0.26
Today daily open104.23
 
Trends
Daily SMA20102.43
Daily SMA50102.28
Daily SMA100102.86
Daily SMA200105.6
 
Levels
Previous Daily High104.31
Previous Daily Low103.82
Previous Weekly High103.63
Previous Weekly Low102.2
Previous Monthly High103.06
Previous Monthly Low100.79
Daily Fibonacci 38.2%104.12
Daily Fibonacci 61.8%104.01
Daily Pivot Point S1103.93
Daily Pivot Point S2103.63
Daily Pivot Point S3103.44
Daily Pivot Point R1104.42
Daily Pivot Point R2104.61
Daily Pivot Point R3104.91

Author

Pablo Piovano

Born and bred in Argentina, Pablo has been carrying on with his passion for FX markets and trading since his first college years.

More from Pablo Piovano
Share:

Editor's Picks

EUR/USD gains ground above 1.1800 ahead of Eurozone HICP release

The EUR/USD pair trades on a firmer note near 1.1830 during the early European session on Wednesday. Nonetheless, the upside for the major pair might be limited as traders remain cautious after a partial government shutdown swiftly ended. Later on Wednesday, the preliminary reading of the Harmonized Index of Consumer Prices from the Eurozone will be closely watched. 

GBP/USD steadies above 1.3700 near nine-day EMA support

GBP/USD steadies after registering modest gains in the previous session, trading around 1.3700 during the Asian hours on Wednesday. The technical analysis of the daily chart points to a potential bearish reversal as the range narrows, indicating waning buyer momentum within a rising wedge pattern.

Gold rallies further beyond $5,050 amid flight to safety, dovish Fed expectations

Gold attracts follow-through buying for the second consecutive day and surges past the $5,000 psychological mark during the Asian session on Wednesday amid the global flight to safety. Concerns over rising tensions between the US and Iran resurfaced following overnight reports that the US shot down an Iranian drone in the Arabian Sea. 

Bitcoin, Ethereum and Ripple extend free fall amid broad market sell-off

Bitcoin, Ethereum, and Ripple remain under pressure so far this week amid the broader market sell-off. BTC reached its lowest level since early November 2024 at $72,945. ETH and XRP, following BTC's lead, extended their losses, with ETH hitting a seven-month low while XRP also slid amid sustained selling pressure.

Gold and silver recovery continues, but equities sink as tech is shunned

The risk recovery is on pause as we move through Tuesday. After signs that a recovery in precious metals could boost overall risk appetite earlier today, a nasty sell off in tech stocks has pushed the Nasdaq and the S&P 500 down by 1.7% and 1.1% respectively.

Solana Price Forecast: SOL drops below $100 as bears tighten grip

Solana (SOL) trades below $100 at press time on Wednesday, after taking a more than 6% hit the previous day as the broader cryptocurrency market slipped. Institutional and retail demand for Solana continues to decline, while on-chain data shows a record 150 million daily transactions on Tuesday.