|
USD Index Price Analysis: Extra gains target the 200-day SMA
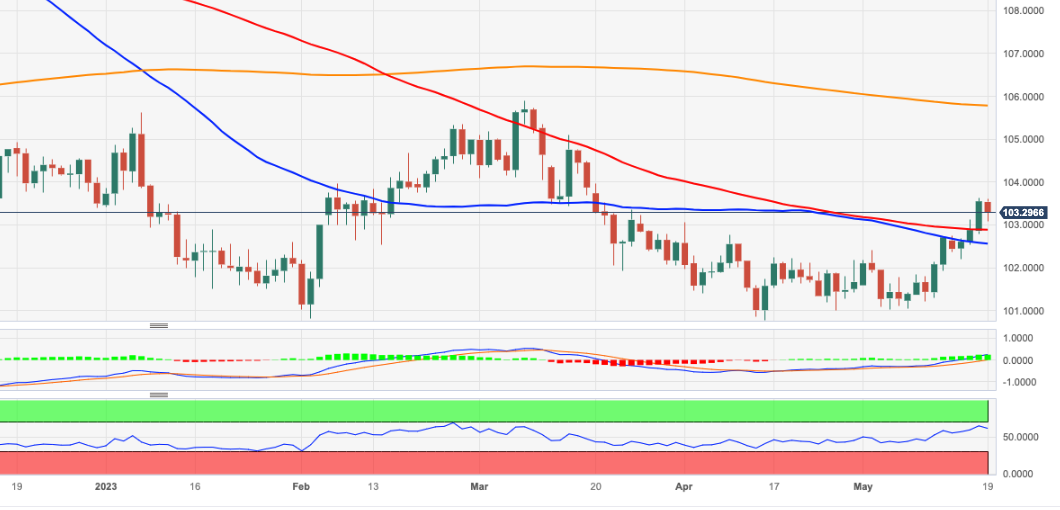
- DXY’s strong upside meets resistance near 103.60 on Friday.
- The key 200-day SMA emerges as the next hurdle near 105.80.

The solid weekly performance of DXY seems to have encountered a firm obstacle around multi-week highs near 103.60 so far on Friday.
Further upside seems like the most probable scenario for the index so far. Against that, a convincing move past 103.60 could pave the way for a potential challenge of the key 200-day SMA, today at 105.78 just ahead of the 2023 peak at 105.88 (March 8).
Looking at the broader picture, while below the 200-day SMA the outlook for the index is expected to remain negative.
DXY daily chart
Author

Pablo Piovano
FXStreet
Born and bred in Argentina, Pablo has been carrying on with his passion for FX markets and trading since his first college years.
More from Pablo Piovano


