|

USD Index Price Analysis: A drop to 104.40 emerges on the horizon

  • DXY extends the weekly retracement below 105.00.
  • Further south comes the weekly low near 104.40.

DXY has been shedding ground for the last three sessions and has opened the door to extra losses in the near term.

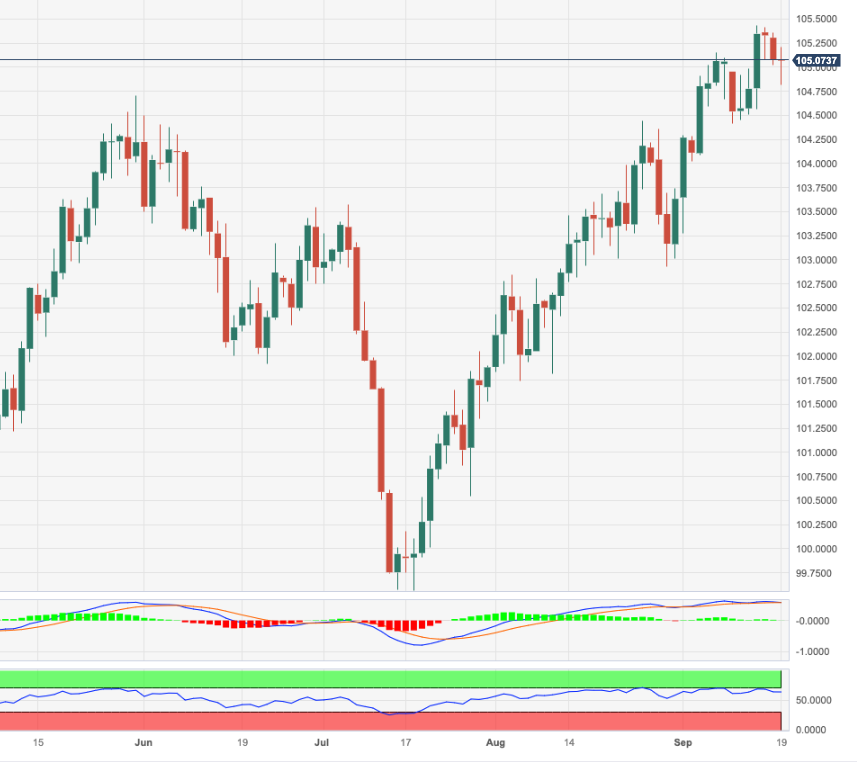
In case the corrective decline picks up further pace, the index could extend the drop to, initially, the weekly low of 104.42 (September 11). A sustained pullback below the latter could prompt the index to embark on a potential test of the critical 200-day SMA, today at 103.03.

While above the key 200-day SMA, the outlook for the index is expected to remain constructive.

DXY daily chart

Dollar Index Spot

Overview
Today last price104.96
Today Daily Change39
Today Daily Change %-0.11
Today daily open105.08
 
Trends
Daily SMA20104.36
Daily SMA50102.84
Daily SMA100102.89
Daily SMA200103.03
 
Levels
Previous Daily High105.36
Previous Daily Low105.02
Previous Weekly High105.44
Previous Weekly Low104.42
Previous Monthly High104.44
Previous Monthly Low101.74
Daily Fibonacci 38.2%105.15
Daily Fibonacci 61.8%105.23
Daily Pivot Point S1104.95
Daily Pivot Point S2104.82
Daily Pivot Point S3104.62
Daily Pivot Point R1105.28
Daily Pivot Point R2105.49
Daily Pivot Point R3105.62

Author

Pablo Piovano

Born and bred in Argentina, Pablo has been carrying on with his passion for FX markets and trading since his first college years.

More from Pablo Piovano
Share:

Editor's Picks

EUR/USD flirts with weekly lows near 1.1770

EUR/USD now comes under further selling pressure, breaking below the 1.1800 support to challenge the area of weekly throughs near 1.1770 on Thursday. The pair’s decline comes in response to marked gains in the US Dollar amid steady geopolitical tensions. Ealier in the day, the ECB’s Lagarde delivered cautious remarks, although the currency remained apathetic.

GBP/USD threatens the 200-day SMA near 1.3440

GBP/USD rapidly leaves behind Wednesday’s strong advance, coming under heavy pressure and retesting the 1.3440 zone, where the critical 200-day SMA is located. Cable’s deep pullback follows the strong gains in the Greenback, while investors continue to pencil in a potential BoE rate cut in March.

Gold trims gains, slips back to around $5,170

Gold is now facing some downside pressure, hovering around the $5,170 region on Thursday. The yellow metal surrenders part of its earlier gains on the back of the resurgence of the buying interest in the Greenback. In the meantime, geopolitical tensions in the Middle East continue to limit the downside potential for now.

Stellar: Relief bounce fades as bearish undertone persists

Stellar is trading around $0.16 at the time of writing on Thursday after rebounding more than 8% in the previous day. Derivatives data paints a negative picture as XLM’s short bets hit a monthly high while Open Interest continues to decline.

Changing the game: International implications of recent tariff developments

The Supreme Court ruling on International Emergency Economic Powers Act (IEEPA) tariffs provides limited relief for the rest of the world, with weighted average tariff rates modestly lower.

Bitcoin steadies as traders eye US–Iran talks

Bitcoin (BTC) price is stabilizing around $68,000 at the time of writing on Thursday after a 6.2% relief rally the previous day amid a broader downward trend.