|

USD/IDR Technical Analysis: Sellers look for entry below monthly trendline, 50-DMA

  • USD/IDR registers the third day of declines.
  • Mid-November lows will be on bear’s radar during further declines.
  • Buyers will wait unless clearing 50% Fibonacci retracement of August-September fall.

USD/IDR drops to 14,090 by the press time of early Thursday in Asia. The pair is on the third day of losing streak but stays above near-term key support confluence.

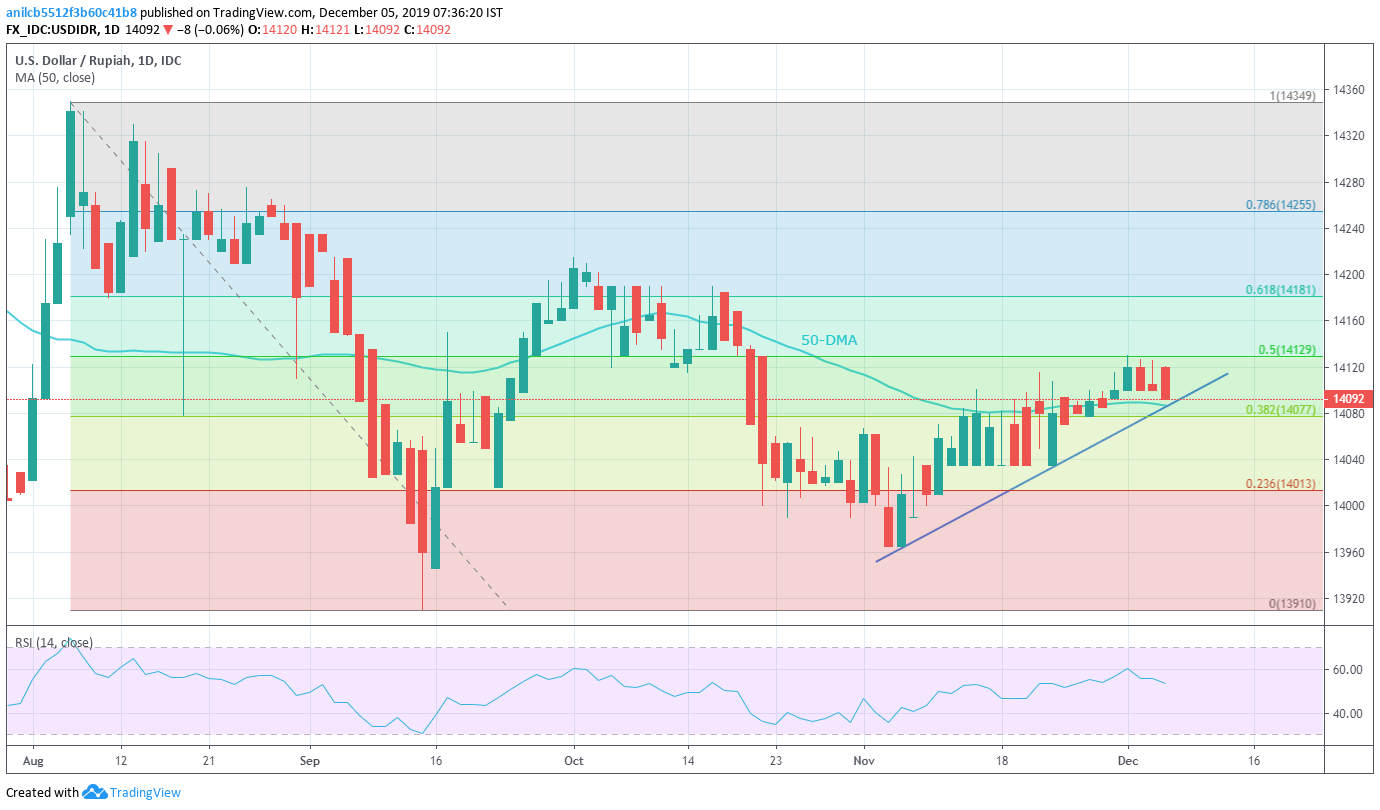
Unless providing a clear break below 14,087/85 area including a month-long rising support line and 50-Day Simple Moving Average (DMA), prices can keep the monthly upward trajectory that leads to 50% Fibonacci retracement level of 14,130.

It’s worth mentioning that 61.8% Fibonacci retracement near 14,180 and October top close to 14,215 will be the Bull’s favorite during pair’s rise past-14,130.

On the contrary, a daily closing below 14,085 could drag prices to multiple lows marked in mid-November around 14,030 ahead of shifting focus to 14,000 round-figure.

Further, the November month low near 13,965 and September bottom close to 13,910 could lure bears afterward.

USD/IDR daily chart

Trend: Pullback expected

additional imortant levels

Overview
Today last price14094.3
Today Daily Change-0.7000
Today Daily Change %-0.00%
Today daily open14095
 
Trends
Daily SMA2014088.8056
Daily SMA5014100.8462
Daily SMA10014119.5951
Daily SMA20014167.3586
 
Levels
Previous Daily High14162
Previous Daily Low14090.5
Previous Weekly High14296.292
Previous Weekly Low13896.3
Previous Monthly High14296.292
Previous Monthly Low13896.3
Daily Fibonacci 38.2%14117.813
Daily Fibonacci 61.8%14134.687
Daily Pivot Point S114069.6667
Daily Pivot Point S214044.3333
Daily Pivot Point S313998.1667
Daily Pivot Point R114141.1667
Daily Pivot Point R214187.3333
Daily Pivot Point R314212.6667

Author

Anil Panchal

Anil Panchal

FXStreet

Anil Panchal has nearly 15 years of experience in tracking financial markets. With a keen interest in macroeconomics, Anil aptly tracks global news/updates and stays well-informed about the global financial moves and their implications.

More from Anil Panchal
Share:

Markets move fast. We move first.

Orange Juice Newsletter brings you expert driven insights - not headlines. Every day on your inbox.

By subscribing you agree to our Terms and conditions.

Editor's Picks

EUR/USD climbs toward 1.1800 on broad USD weakness

EUR/USD gathers bullish momentum and advances toward 1.1800 in the second half of the day on Tuesday. The US Dollar weakens and helps the pair stretch higher after the employment report showed that Nonfarm Payrolls declined by 105,000 in October before rising by 64,000 in November.

GBP/USD climbs to fresh two-month high above 1.3400

GBP/USD gains traction in the American session and trades at its highest level since mid-October above 1.3430. The British Pound benefits from upbeat PMI data, while the US Dollar struggles to find demand following the mixed employment figures and weaker-than-forecast PMI prints, allowing the pair to march north.

Gold recovers above $4,300 as markets react to weak US data

Gold trades in positive above $4,300 after spending the first half of the day under bearish pressure. XAU/USD capitalizes on renewed USD weakness after the jobs report showed that the Unemployment Rate climbed to 4.6% in November and the PMI data revealed a loss of growth momentum in the private sector in December. 

US Retail Sales virtually unchanged at $732.6 billion in October

Retail Sales in the United States were virtually unchanged at $732.6 billion in October, the US Census Bureau reported on Tuesday. This print followed the 0.1% increase (revised from 0.3%) recorded in September and came in below the market expectation of +0.1%.

Ukraine-Russia in the spotlight once again

Since the start of the week, gold’s price has moved lower, but has yet to erase the gains made last week. In today’s report we intend to focus on the newest round of peace talks between Russia and Ukraine, whilst noting the release of the US Employment data later on day and end our report with an update in regards to the tensions brewing in Venezuela.

BNB Price Forecast: BNB slips below $855 as bearish on-chain signals and momentum indicators turn negative

BNB, formerly known as Binance Coin, continues to trade down around $855 at the time of writing on Tuesday, after a slight decline the previous day. Bearish sentiment further strengthens as BNB’s on-chain and derivatives data show rising retail activity.