USD/IDR technical analysis: Immediate upside restricted around 14,032/40 amid bearish MACD
- USD/IDR confronts 50-bar SMA, 61.8% Fibonacci retracement amid bearish MACD signal.
- The short-term symmetrical triangle limits the pair’s moves.
Despite bouncing off during the post-Indonesia inflation release, on Friday, USD/IDR fails to clear the key resistance confluence while taking rounds to 14,035 on early Monday.
Prices need to clear 14,032/40 area including 50-bar Simple Moving Average (SMA) and 61.8% Fibonacci retracement of September-October upside to extend the latest pullback towards 14,080, comprising 50% Fibonacci retracement.
Though, pair’s further advances will be challenged by a descending trend line since October 16, at 14,120, if not then 14,200 and 14,230 will be the key to watch.
Alternatively, pair’s immediate declines are confined by an upward sloping support line since October 24, at 13,996 now, if not then 13,970 and 13,880 should be on sellers’ radar.
Considering bearish signal from 12-bar Moving Average Convergence and Divergence (MACD), prices could find hard to extend the recent recovery.
USD/IDR 4-hour chart
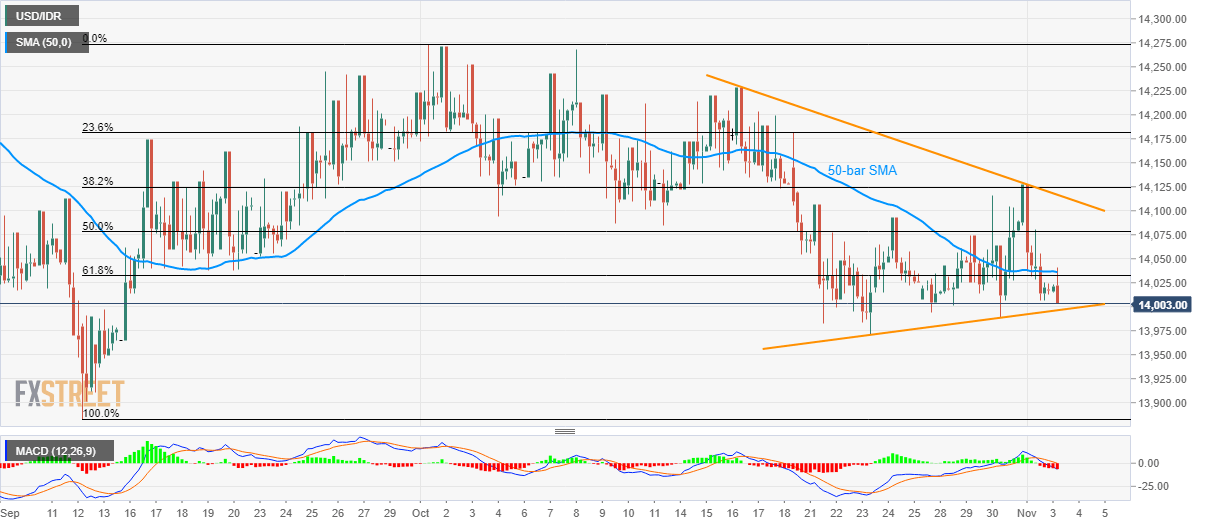
Trend: sideways
Author

Anil Panchal
FXStreet
Anil Panchal has nearly 15 years of experience in tracking financial markets. With a keen interest in macroeconomics, Anil aptly tracks global news/updates and stays well-informed about the global financial moves and their implications.


