USD/IDR Technical Analysis: Break of 50-day SMA highlights 23.6% Fibo. surrounding 14,055

USD/IDR trades near 14,100 during early Monday. The quote dropped beneath 50-day simple moving average (SMA) for the first time in a month on Friday.
While the break of 50-day SMA favors the odds for further decline, 23.6% Fibonacci retracement of December 26 to February 05 downside, surrounding the March month low of 14,056 could challenge the sellers.
In a case, prices slip beneath 14,055, 14,000 and February 25 low near 13,970 may offer intermediate halt to the downside towards the year’s low around 13,950.
Meanwhile, 50-day SMA level of 14,140 can act as an immediate upside barrier, a break of which can recall 14,120 and 100-day SMA level of 14,235 on the chart.
Should there be additional rise past-14,235, a downward sloping trend-line since March could question Bulls near 14,300.
USD/IDR daily chart
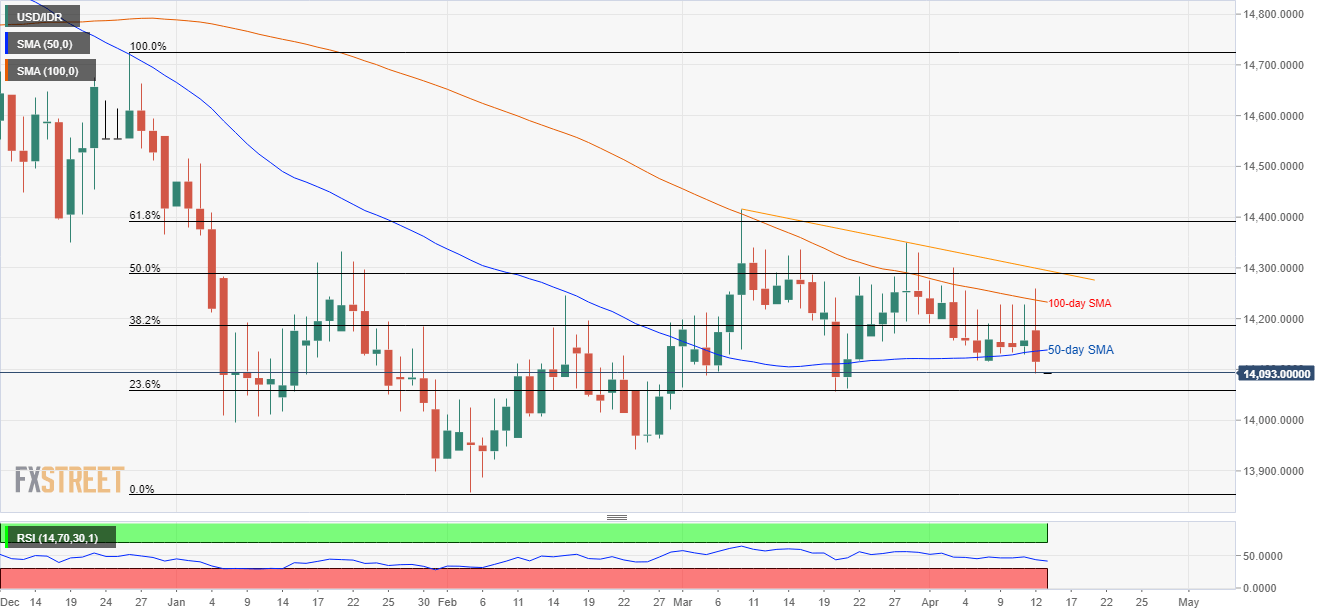
Trend: Bearish
Author

Anil Panchal
FXStreet
Anil Panchal has nearly 15 years of experience in tracking financial markets. With a keen interest in macroeconomics, Anil aptly tracks global news/updates and stays well-informed about the global financial moves and their implications.


