USD/IDR technical analysis: 21-DMA, 9-week old resistance-line exert downside pressure
- Repeated failures to cross key near-term upside barriers portray USD/IDR weakness.
- Immediate ascending trend-line can limit the pair’s declines.

Not only medium-term descending trend-line but 21-day moving average (DMA) also limits USD/IDR upside as it takes the rounds to 14,020 during Asian trading session on Tuesday.
In order to question the downward sloping resistance-line stretched since late-May, at 14,084, the quote first needs a successful break beyond 21-DMA level of 14,033.
If prices rise above 14,084, 100-DMA figure of 14,196 and current month high at 14,240 can lure buyers.
On the contrary, July 19 high around 13,980 and a short-term ascending trend-line near 13,930 can entertain sellers ahead of pushing them to question month’s low at 13,884.
USD/IDR daily chart
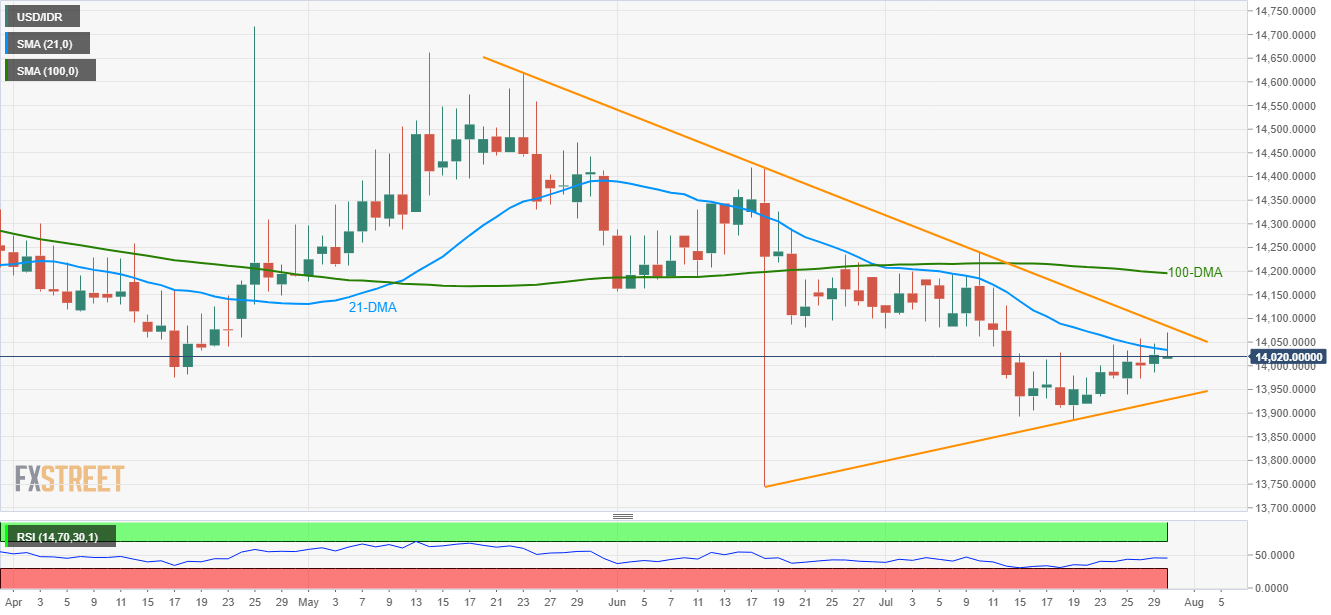
Trend: Bearish
Author

Anil Panchal
FXStreet
Anil Panchal has nearly 15 years of experience in tracking financial markets. With a keen interest in macroeconomics, Anil aptly tracks global news/updates and stays well-informed about the global financial moves and their implications.


