|

USD/CNH technical analysis: Buyers keep lurking around 23.6% Fibo, 21-day EMA

  • USD/CNH remains choppy in a range between key support confluence and 10-day EMA.
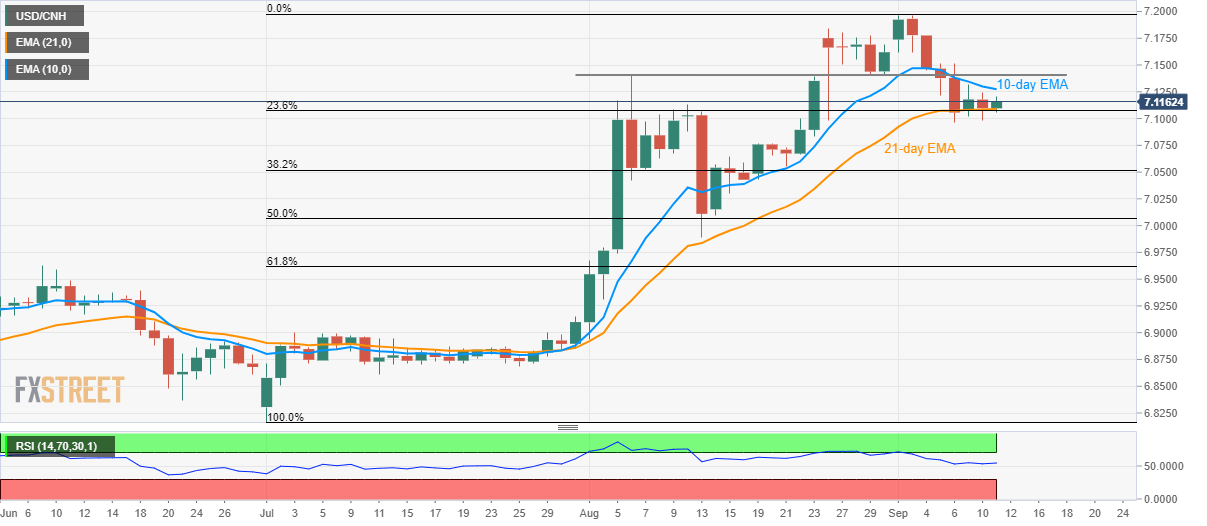
  • A downside break can drag the quote to 7.0770/65 while 7.1400/10 could challenge the advances beyond short-term EMA.

Despite being above near-term key support-confluence, USD/CNH stays under 10-day exponential moving average (EMA) as it takes rounds to 7.1180 during early Wednesday.

While strong downside support and upbeat levels of 14-day relative strength index (RSI), the pair is more likely to rise past-immediate EMA level of 7.1275 and head towards the five-week-old horizontal area around 7.1400/10.

During the pair’s run-up above 7.1410, 7.1630 and recent high surrounding 7.1970 may entertain buyers ahead of highlighting 7.2000 mark.

On the downside, pair’s break beneath 7.1090/75, including 21-day EMA and 23.6% Fibonacci retracement of July-September upside, can revisit August 19/20 highs surrounding 7.0770/65 whereas 38.2% Fibonacci retracement close to 7.0520 will flash on sellers radar afterward.

USD/CNH daily chart

Trend: sideways

additional important levels

Overview
Today last price7.1177
Today Daily Change0.0082
Today Daily Change %0.12%
Today daily open7.1095
 
Trends
Daily SMA207.1191
Daily SMA507.0077
Daily SMA1006.9413
Daily SMA2006.8577
Levels
Previous Daily High7.124
Previous Daily Low7.0986
Previous Weekly High7.1967
Previous Weekly Low7.096
Previous Monthly High7.1838
Previous Monthly Low6.894
Daily Fibonacci 38.2%7.1083
Daily Fibonacci 61.8%7.1143
Daily Pivot Point S17.0974
Daily Pivot Point S27.0852
Daily Pivot Point S37.0719
Daily Pivot Point R17.1229
Daily Pivot Point R27.1362
Daily Pivot Point R37.1483

Author

Anil Panchal

Anil Panchal

FXStreet

Anil Panchal has nearly 15 years of experience in tracking financial markets. With a keen interest in macroeconomics, Anil aptly tracks global news/updates and stays well-informed about the global financial moves and their implications.

More from Anil Panchal
Share:

Editor's Picks

EUR/USD holds above 1.1750 after mixed EU PMI data

EUR/USD manages to hold above 1.1750 but struggles to gather recovery momentum on Friday, following the mixed February PMI figures from Germany and the Eurozone. In the second half of the day, Q4 GDP, December inflation and February PMI data from the US will be watched closely by market participants.

GBP/USD recovers further toward 1.3500 after UK PMI data

GBP/USD is recovering ground further toward 1.3500 in European trading on Friday, helped by a modest uptick in the Pound Sterling after stronger-than-expected UK January Retail Sales and February PMI data. However, the pair's further upside could be limited amid persistent US Dollar strength as the focus turns to key US data. 

Gold sticks to positive bias above $5,000 ahead of US data

Gold gains some positive traction for the third consecutive day on Friday. holding above $5,000. Traders now look forward to the key US macro releases – the Advance Q4 GDP report and the Personal Consumption Expenditures (PCE) Price Index – for fresh trading impetus. 

US GDP growth expected to slow down significantly in Q4 after stellar Q3 

The United States Bureau of Economic Analysis will publish the first preliminary estimate of the fourth-quarter Gross Domestic Product at 13:30 GMT. Analysts forecast the US economy to have expanded at a 3% annualized rate, slowing down from the 4.4% growth posted in the previous quarter.

Iran tensions and AI fears at the forefront ahead of key US data

Thursday’s scorecard shows major US Stock benchmarks closed modestly in the red amid mounting US-Iran tensions and AI disruption worries. The S&P 500 shed 19 points (0.3%) to 6,861, the Nasdaq 100 lost 101 points (0.4%) to 24,797, and the Dow Jones Industrial Average dropped 267 points (0.5%) to 49,395.

Official Trump price approaches breakout with mixed signals from traders

Official Trump (TRUMP) is trading at $3.50 at the time of writing, approaching its upper consolidation range. A breakout from this range could open the door for an upside move. On-chain data shows market indecision, with balanced flows between bulls and bears, signaling a lack of clear directional bias.