|

USD/CNH Price Analysis: Weekly chart suggests further downside

  • USD/CNH keeps the break of 16-month-old trend line despite bouncing off 6.9276.
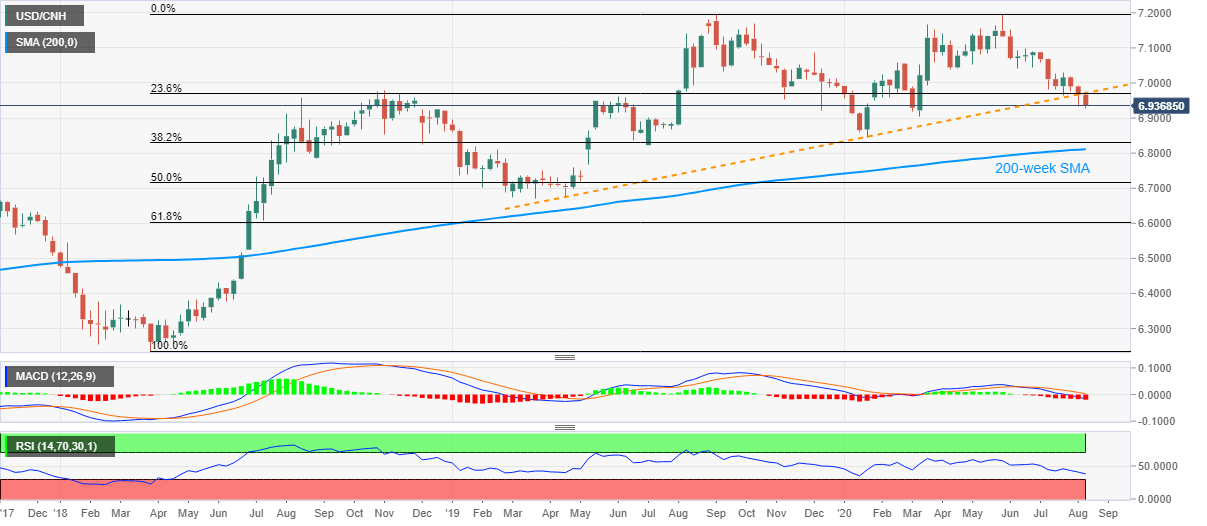
  • Bearish MACD, lack of oversold RSI indicates room for additional declines.
  • 6.9700 resistance confluence restricts the pair’s immediate upside.

USD/CNH picks up the bids near 6.9355/60 during the early Thursday. The pair refreshed five-month low the previous day. In doing so, it extends the downside break of an ascending trend line from April 2019.

Other than the sustained downside below the key support line, now resistance, bearish MACD and an absence of oversold RSI conditions also favor the sellers.

As a result, March month’s low near 6.9050 acts as immediate support for the pair sellers to watch ahead of 6.9000 round-figures. In a case where the bears dominate past-6.9000, the yearly bottom surrounding 6.8455 will be challenged.

Alternatively, the support-turned-resistance line joins 23.6% Fibonacci retracement of the pair’s upside between March 2018 and September 2019 to confine the immediate upside near 6.9700.

Additionally, 7.000 psychological magnet and late-July top near 7.0300 could lure the bulls past-6.9700.

USD/CNH weekly chart

Trend: Bearish

Additional important levels

Overview
Today last price6.9348
Today Daily Change0.0018
Today Daily Change %0.03%
Today daily open6.933
 
Trends
Daily SMA206.9819
Daily SMA507.0265
Daily SMA1007.0655
Daily SMA2007.0297
 
Levels
Previous Daily High6.955
Previous Daily Low6.9316
Previous Weekly High6.9938
Previous Weekly Low6.9322
Previous Monthly High7.0764
Previous Monthly Low6.9642
Daily Fibonacci 38.2%6.9406
Daily Fibonacci 61.8%6.946
Daily Pivot Point S16.9248
Daily Pivot Point S26.9166
Daily Pivot Point S36.9015
Daily Pivot Point R16.9481
Daily Pivot Point R26.9632
Daily Pivot Point R36.9714

Author

Anil Panchal

Anil Panchal

FXStreet

Anil Panchal has nearly 15 years of experience in tracking financial markets. With a keen interest in macroeconomics, Anil aptly tracks global news/updates and stays well-informed about the global financial moves and their implications.

More from Anil Panchal
Share:

Editor's Picks

EUR/USD keeps the rangebound trade near 1.1850

EUR/USD is still under pressure, drifting back towards the 1.1850 area as Monday’s session draws to a close. The modest decline in spot comes as the US Dollar picks up a bit of support, while thin liquidity and muted volatility, thanks to the US market holiday, are exaggerating price swings and keeping trading conditions choppy.
 

GBP/USD trades with negative bias, eyes 1.3600 ahead of UK jobs data

The GBP/USD pair trades with a negative bias for the second straight day, though it lacks bearish conviction and holds above the 1.3600 mark through the Asian session on Tuesday. Traders now look forward to the release of the UK monthly jobs report, which will influence the British Pound and provide some impetus to the currency pair.

Gold sticks to a negative bias below $5,000; lacks bearish conviction

Gold remains depressed for the second consecutive day and trades below the $5,000 psychological mark during the Asian session on Tuesday, as a positive risk tone is seen undermining safe-haven assets. Meanwhile, bets for more interest rate cuts by the Fed keep a lid on the recent US Dollar bounce and act as a tailwind for the non-yielding bullion, warranting caution for bearish traders ahead of FOMC minutes on Wednesday.

AI Crypto Update: Bittensor eyes breakout as AI tokens falter 

The artificial intelligence (AI) cryptocurrency segment is witnessing heightened volatility, with top tokens such as Near Protocol (NEAR) struggling to gain traction amid the persistent decline in January and February.

US CPI is cooling but what about inflation?

The January CPI data give the impression that the Federal Reserve is finally winning the war against inflation. Not only was the data cooler than expected, but it’s also beginning to edge close to the mystical 2 percent target. CBS News called it “the best inflation news we've had in months.”

XRP steadies in narrow range as fund inflows, futures interest rise

Ripple is trading in a narrow range between $1.45 (immediate support) and $1.50 (resistance) at the time of writing on Monday. The remittance token extended its recovery last week, peaking at $1.67 on Sunday from the weekly open at $1.43.