|

USD/CNH Price Analysis: Remains above 7.3500 near two-year highs

  • USD/CNH could approach initial resistance at 7.3697, marking the highest level since October 2022.
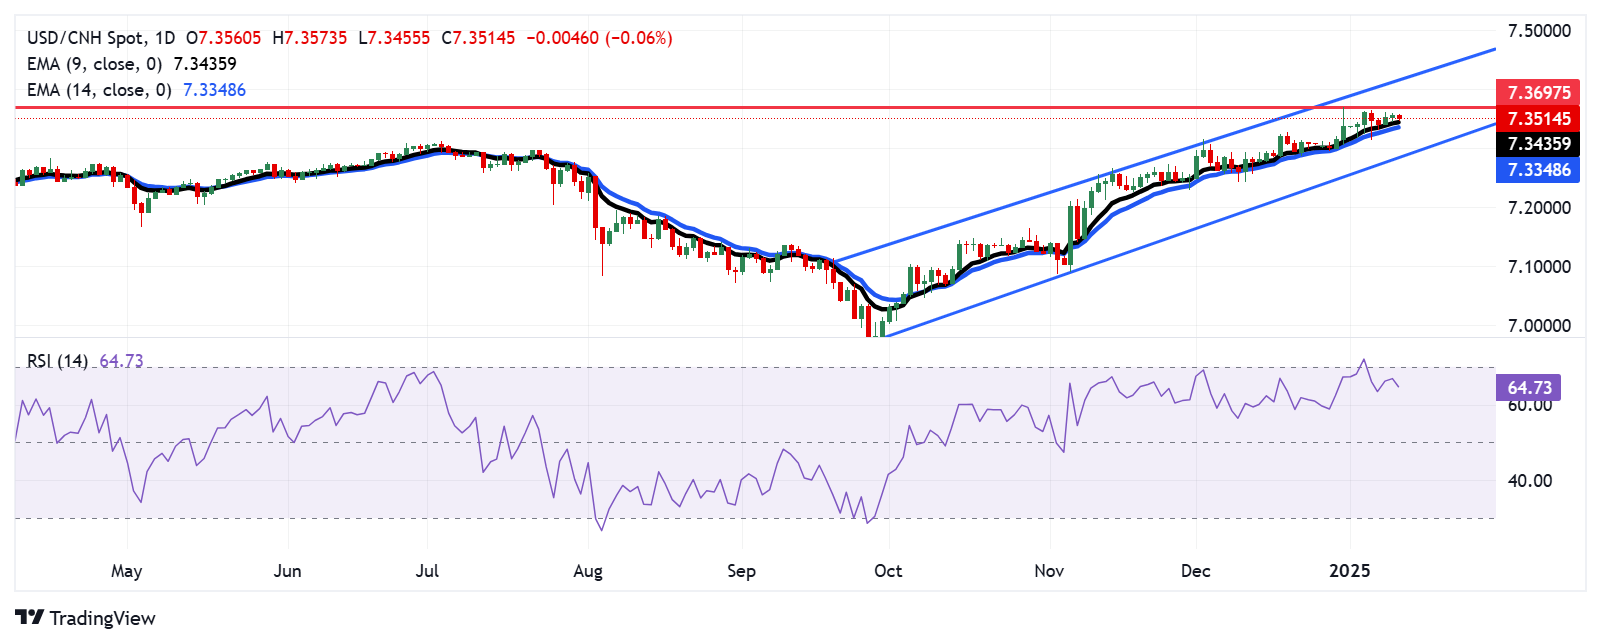
  • The 14-day RSI remains below the 70 level, further supporting the sustained bullish bias.
  • The immediate support zone is seen around the nine-day EMA at the 7.3435 level.

The USD/CNH pair retraces its two days of gains, trading around 7.3520 during the Asian hours on Friday. An analysis of the daily chart indicates that the price movement within the ascending channel pattern is intensifying, which points to a strengthening bullish trend.

The 14-day Relative Strength Index (RSI), a key momentum indicator, holds below the 70 level, reinforcing the ongoing bullish momentum. Moreover, the USD/CNH pair trades above both the nine-day and 14-day Exponential Moving Averages (EMAs), further suggesting robust short-term price momentum.

The USD/CNH pair could test primary resistance at 7.3697, the highest level since October 2022, reached on December 31. A break above this level could reinforce the bullish bias and support the pair to approach the upper boundary of the ascending channel at the 7.4150 level.

On the downside, the USD/CNH pair may initially test the nine-day Exponential Moving Average at the 7.3435 level, followed by the 14-day EMA at the 7.3348 level. A break below this level would weaken the short-term price momentum and lead the pair to navigate the area around the ascending channel’s lower boundary at the 7.2890 level.

USD/CNH: Daily Chart

Author

Akhtar Faruqui

Akhtar Faruqui is a Forex Analyst based in New Delhi, India. With a keen eye for market trends and a passion for dissecting complex financial dynamics, he is dedicated to delivering accurate and insightful Forex news and analysis.

More from Akhtar Faruqui
Share:

Markets move fast. We move first.

Orange Juice Newsletter brings you expert driven insights - not headlines. Every day on your inbox.

By subscribing you agree to our Terms and conditions.

Editor's Picks

EUR/USD drops to daily lows near 1.1630

EUR/USD now loses some traction and slips back to the area of daily lows around 1.1630 on the back of a mild bounce in the US Dollar. Fresh US data, including the September PCE inflation numbers and the latest read on December consumer sentiment, didn’t really move the needle, so the pair is still on course to finish the week with a respectable gain.

GBP/USD trims gains, recedes toward 1.3320

GBP/USD is struggling to keep its daily advance, coming under fresh pressure and retreating to the 1.3320 zone following a mild bullish attempt in the Greenback. Even though US consumer sentiment surprised to the upside, the US Dollar isn’t getting much love, as traders are far more interested in what the Fed will say next week.

Gold makes a U-turn, back to $4,200

Gold is now losing the grip and receding to the key $4,200 region per troy ounce following some signs of life in the Greenback and a marked bounce in US Treasury yields across the board. The positive outlook for the precious metal, however, remains underpinned by steady bets for extra easing by the Fed.

Crypto Today: Bitcoin, Ethereum, XRP pare gains despite increasing hopes of upcoming Fed rate cut

Bitcoin is steadying above $91,000 at the time of writing on Friday. Ethereum remains above $3,100, reflecting positive sentiment ahead of the Federal Reserve's (Fed) monetary policy meeting on December 10.

Week ahead – Rate cut or market shock? The Fed decides

Fed rate cut widely expected; dot plot and overall meeting rhetoric also matter. Risk appetite is supported by Fed rate cut expectations; cryptos show signs of life. RBA, BoC and SNB also meet; chances of surprises are relatively low.

Ripple faces persistent bear risks, shrugging off ETF inflows

Ripple is extending its decline for the second consecutive day, trading at $2.06 at the time of writing on Friday. Sentiment surrounding the cross-border remittance token continues to lag despite steady inflows into XRP spot ETFs.