USD/CNH Price Analysis: Extends pullback from weekly resistance below 7.3200 even as China data disappoints


  • USD/CNH renews intraday low, stays defensive after reversing from short-term key resistance line.
  • China’s Caixin Services PMI dropped to five-month low.
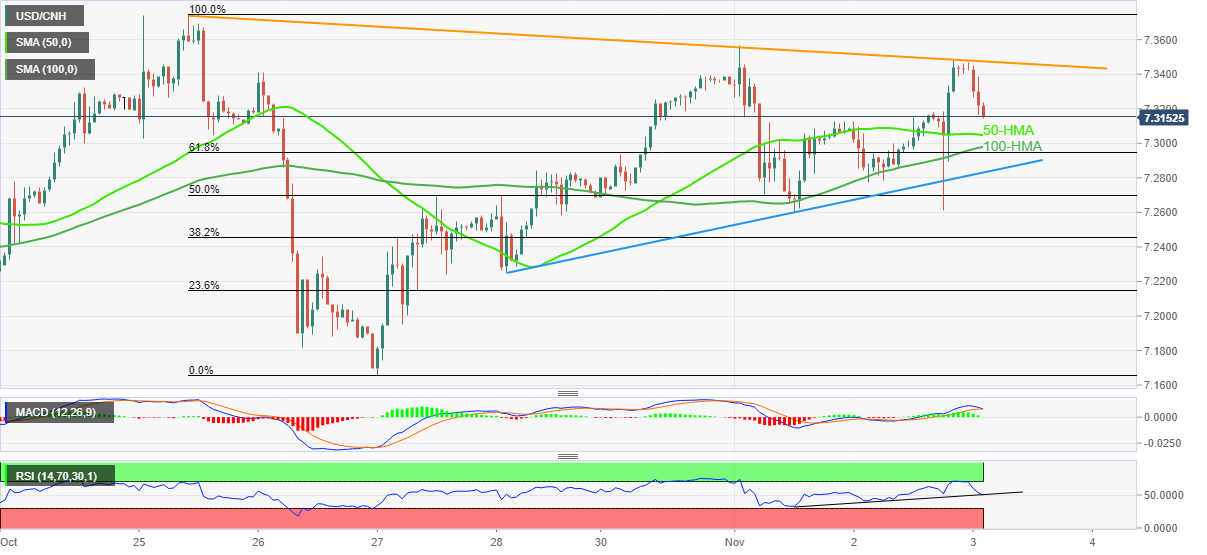
  • Key HMAs, RSI conditions suggest a bumpy road for the bears.

USD/CNH ticks down to refresh intraday low near 7.3160 after China reported downbeat services activity data during early Thursday.

In doing so, the offshore Chinese currency (CNH) pair consolidates the Fed-inspired gains but struggles to extend the late Wednesday’s pullback from a one-week-old descending resistance line.

That said, China’s Caixin/S&P Global Services PMI for October dropped to the lowest level in five months while flashing 48.4 figure versus 49.3 prior.

Despite the quote’s latest inaction, the bearish MACD signals and the U-turn from a short-term key resistance line direct USD/CNH sellers toward the 50-HMA and 100-HMA support levels, respectively near 7.3050 and 7.2980.

However, an upward-sloping support line from Friday, near 7.2840, joins the ascending support line on RSI (14) to challenge the pair bears afterward.

Alternatively, recovery moves need to cross the aforementioned resistance line, close to 7.3485, to convince USD/CNH buyers.

Following that, a run-up towards the all-time high marked in October around 7.3750 can’t be ruled out.

To sum up, USD/CNH justifies short-term bearish technical signals despite weaker fundamentals to support sellers. Though, the downside room appears limited.

USD/CNH: Hourly chart

Trend: Limited downside expected

Additional important levels

Overview
Today last price 7.3186
Today Daily Change -0.0250
Today Daily Change % -0.34%
Today daily open 7.3436
 
Trends
Daily SMA20 7.2321
Daily SMA50 7.0984
Daily SMA100 6.9225
Daily SMA200 6.707
 
Levels
Previous Daily High 7.3486
Previous Daily Low 7.2608
Previous Weekly High 7.3748
Previous Weekly Low 7.1658
Previous Monthly High 7.3748
Previous Monthly Low 7.0126
Daily Fibonacci 38.2% 7.315
Daily Fibonacci 61.8% 7.2944
Daily Pivot Point S1 7.2868
Daily Pivot Point S2 7.23
Daily Pivot Point S3 7.1991
Daily Pivot Point R1 7.3745
Daily Pivot Point R2 7.4054
Daily Pivot Point R3 7.4622


Share: Feed news

Information on these pages contains forward-looking statements that involve risks and uncertainties. Markets and instruments profiled on this page are for informational purposes only and should not in any way come across as a recommendation to buy or sell in these assets. You should do your own thorough research before making any investment decisions. FXStreet does not in any way guarantee that this information is free from mistakes, errors, or material misstatements. It also does not guarantee that this information is of a timely nature. Investing in Open Markets involves a great deal of risk, including the loss of all or a portion of your investment, as well as emotional distress. All risks, losses and costs associated with investing, including total loss of principal, are your responsibility. The views and opinions expressed in this article are those of the authors and do not necessarily reflect the official policy or position of FXStreet nor its advertisers. The author will not be held responsible for information that is found at the end of links posted on this page.

If not otherwise explicitly mentioned in the body of the article, at the time of writing, the author has no position in any stock mentioned in this article and no business relationship with any company mentioned. The author has not received compensation for writing this article, other than from FXStreet.

FXStreet and the author do not provide personalized recommendations. The author makes no representations as to the accuracy, completeness, or suitability of this information. FXStreet and the author will not be liable for any errors, omissions or any losses, injuries or damages arising from this information and its display or use. Errors and omissions excepted.

The author and FXStreet are not registered investment advisors and nothing in this article is intended to be investment advice.

Recommended content


Recommended content

Editors’ Picks

AUD/USD remained bid above 0.6500

AUD/USD remained bid above 0.6500

AUD/USD extended further its bullish performance, advancing for the fourth session in a row on Thursday, although a sustainable breakout of the key 200-day SMA at 0.6526 still remain elusive.

AUD/USD News

EUR/USD faces a minor resistance near at 1.0750

EUR/USD faces a minor resistance near at 1.0750

EUR/USD quickly left behind Wednesday’s small downtick and resumed its uptrend north of 1.0700 the figure, always on the back of the persistent sell-off in the US Dollar ahead of key PCE data on Friday.

EUR/USD News

Gold holds around $2,330 after dismal US data

Gold holds around $2,330 after dismal US data

Gold fell below $2,320 in the early American session as US yields shot higher after the data showed a significant increase in the US GDP price deflator in Q1. With safe-haven flows dominating the markets, however, XAU/USD reversed its direction and rose above $2,340.

Gold News

Bitcoin price continues to get rejected from $65K resistance as SEC delays decision on spot BTC ETF options

Bitcoin price continues to get rejected from $65K resistance as SEC delays decision on spot BTC ETF options

Bitcoin (BTC) price has markets in disarray, provoking a broader market crash as it slumped to the $62,000 range on Thursday. Meanwhile, reverberations from spot BTC exchange-traded funds (ETFs) continue to influence the market.

Read more

US economy: slower growth with stronger inflation

US economy: slower growth with stronger inflation

The dollar strengthened, and stocks fell after statistical data from the US. The focus was on the preliminary estimate of GDP for the first quarter. Annualised quarterly growth came in at just 1.6%, down from the 2.5% and 3.4% previously forecast.

Read more

Forex MAJORS

Cryptocurrencies

Signatures