|

USD/CNH Price Analysis: Bulls pierce 200-week SMA to renew 18-month high

  • USD/CNH rises for third consecutive day to refresh the multi-day top, sidelined of late.
  • 200-week SMA, 50% Fibonacci retracement level tests bulls amid overbought RSI.
  • Pullback remains elusive beyond April 2021 swing high.

USD/CNH prints a three-day uptrend to renew the 18-month high around 6.7475 during Monday’s Asian session.

In doing so, the offshore Chinese yuan (CNH) pair crosses the 200-week moving average amid the market’s rush for risk safety, as well as anxiety ahead of China's trade numbers for April.

It should be noted, however, that the overbought RSI conditions and the crucial SMA level, around 6.7385 by the press time, challenge USD/CNH bulls.

Also acting as the key upside filter is the 50% Fibonacci retracement (Fibo.) of the May 2020 to February 2022 downtrend, around 6.7515.

Meanwhile, a pullback move could aim for the 38.2% Fibo level, surrounding 6.6460, but remains elusive until breaking the April 2021 swing high towards the south, at 6.5875.

Overall, USD/CNH is likely to witness a pullback but the latest risk-aversion wave challenges the moves.

USD/CNH: Weekly chart

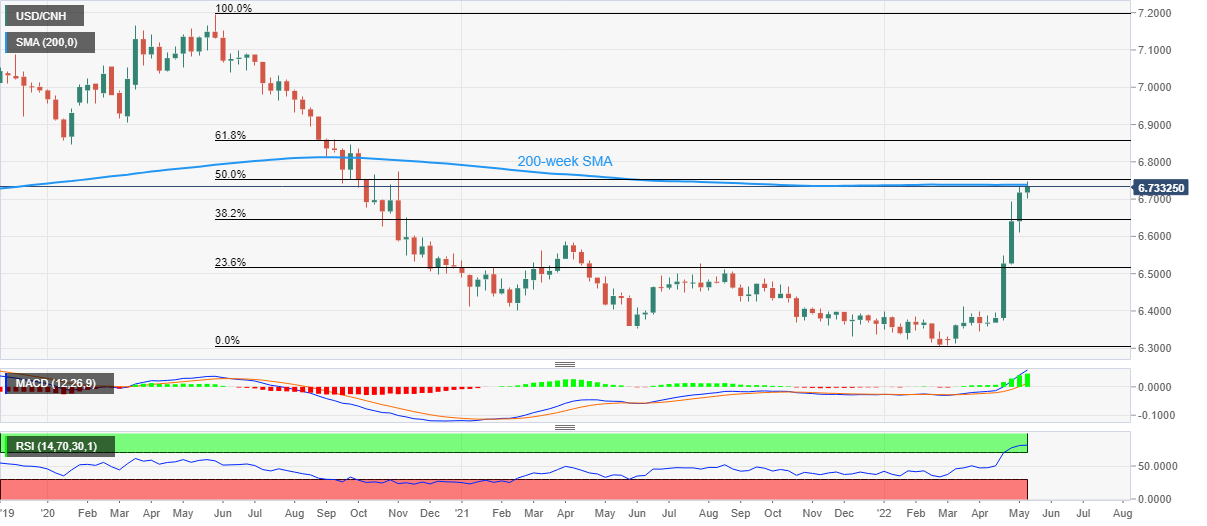
Trend: Pullback expected

Additional important levels

Overview
Today last price6.7326
Today Daily Change0.0150
Today Daily Change %0.22%
Today daily open6.7176
 
Trends
Daily SMA206.5278
Daily SMA506.4257
Daily SMA1006.3918
Daily SMA2006.4098
 
Levels
Previous Daily High6.7342
Previous Daily Low6.6822
Previous Weekly High6.7342
Previous Weekly Low6.6116
Previous Monthly High6.694
Previous Monthly Low6.3512
Daily Fibonacci 38.2%6.7144
Daily Fibonacci 61.8%6.7021
Daily Pivot Point S16.6885
Daily Pivot Point S26.6594
Daily Pivot Point S36.6365
Daily Pivot Point R16.7405
Daily Pivot Point R26.7634
Daily Pivot Point R36.7925

Author

Anil Panchal

Anil Panchal

FXStreet

Anil Panchal has nearly 15 years of experience in tracking financial markets. With a keen interest in macroeconomics, Anil aptly tracks global news/updates and stays well-informed about the global financial moves and their implications.

More from Anil Panchal
Share:

Editor's Picks

EUR/USD remains offered below 1.1600, seems vulnerable near multi-month low

The EUR/USD pair struggles to capitalize on the overnight bounce from the 1.1530 region, or the lowest level since November 2025, and lower for the third consecutive day on Wednesday. Spot prices slide back below the 1.1600 mark during the Asian session and seem vulnerable to slide further.

GBP/USD slips below key averages as geopolitical risks mount

GBP/USD fell about 0.35% on Tuesday, settling around 1.3350 after slipping below the 200-day Exponential Moving Average for the first time since early December. The pair has pulled back sharply from its late-January high near 1.3870, shedding over 500 pips in a series of lower highs and lower lows. 

Gold rebounds ahead of US ADP, will it last?

Gold finds renewed Asian bids and retests $5,230 early Wednesday after the heavy sell-off on Tuesday. The US Dollar stands tall amid escalating Middle East tensions and reduced dovish Fed expectations. Gold defends $5,000 or 50% Fibo level after facing rejection at the 78.6% Fibo resistance at $5,342 amid bullish RSI.  

Ethereum: Whales step up buying as short positions contract

After holding firm heading into the last weekend, Ethereum whales have returned to action, pouncing on the volatility stemming from escalating military actions between the US and Iran.

Energy shock 2.0: Why rising Gas prices could hit the Euro

Even without a confirmed, sustained disruption, the mere risk to a key global energy chokepoint is enough to inject a significant premium into European Gas markets. And for the Euro, that matters.

Ripple falters amid sell-off jitters and negative funding rates

Ripple (XRP) has come under pressure, drifting lower to $1.35 at the time of writing on Tuesday. The over 2% correction looks poised to erase the previous day’s gains, which lifted the remittance token to $1.42.