USD/CHF Technical Analysis: Swissy sidelined near 1.0060 level

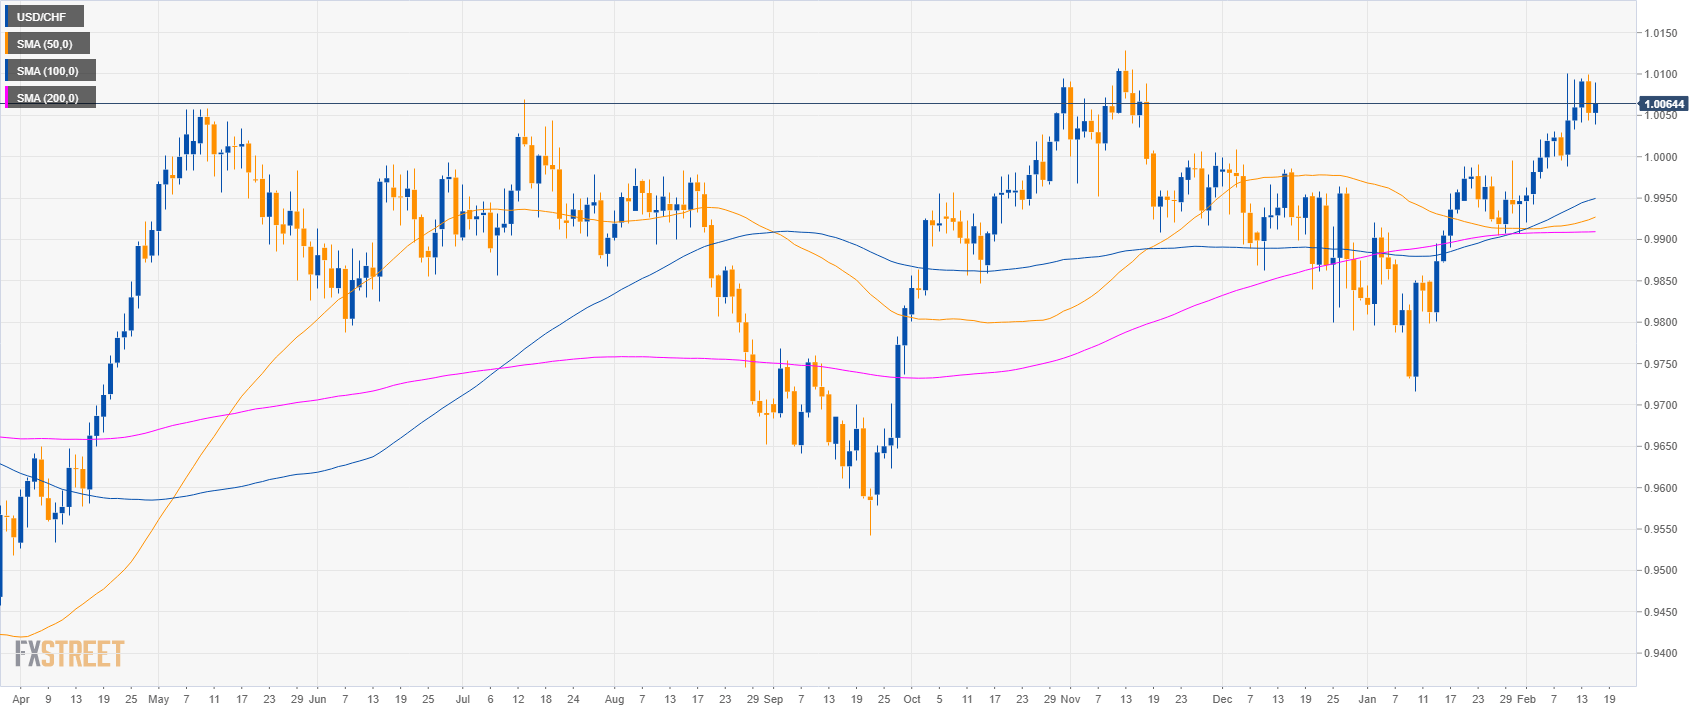
USD/CHF daily chart
- USD/CHF is trading in a sideways trend above the 50, 100 and 200-day simple moving averages (SMAs).
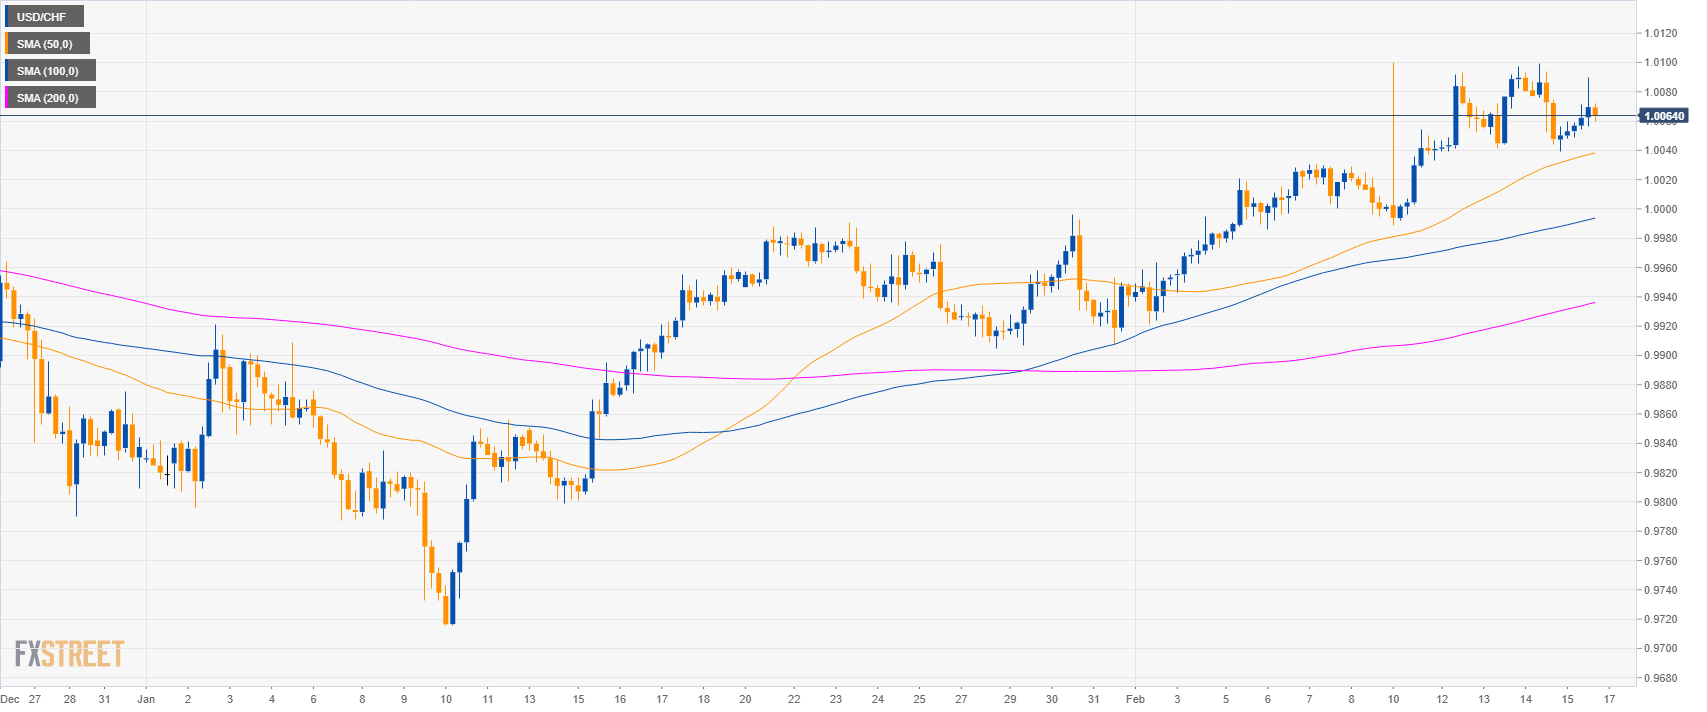
USD/CHF 4-hour chart
- USD/CHF is trading above its main SMAs suggesting bullish momentum in the medium-term.
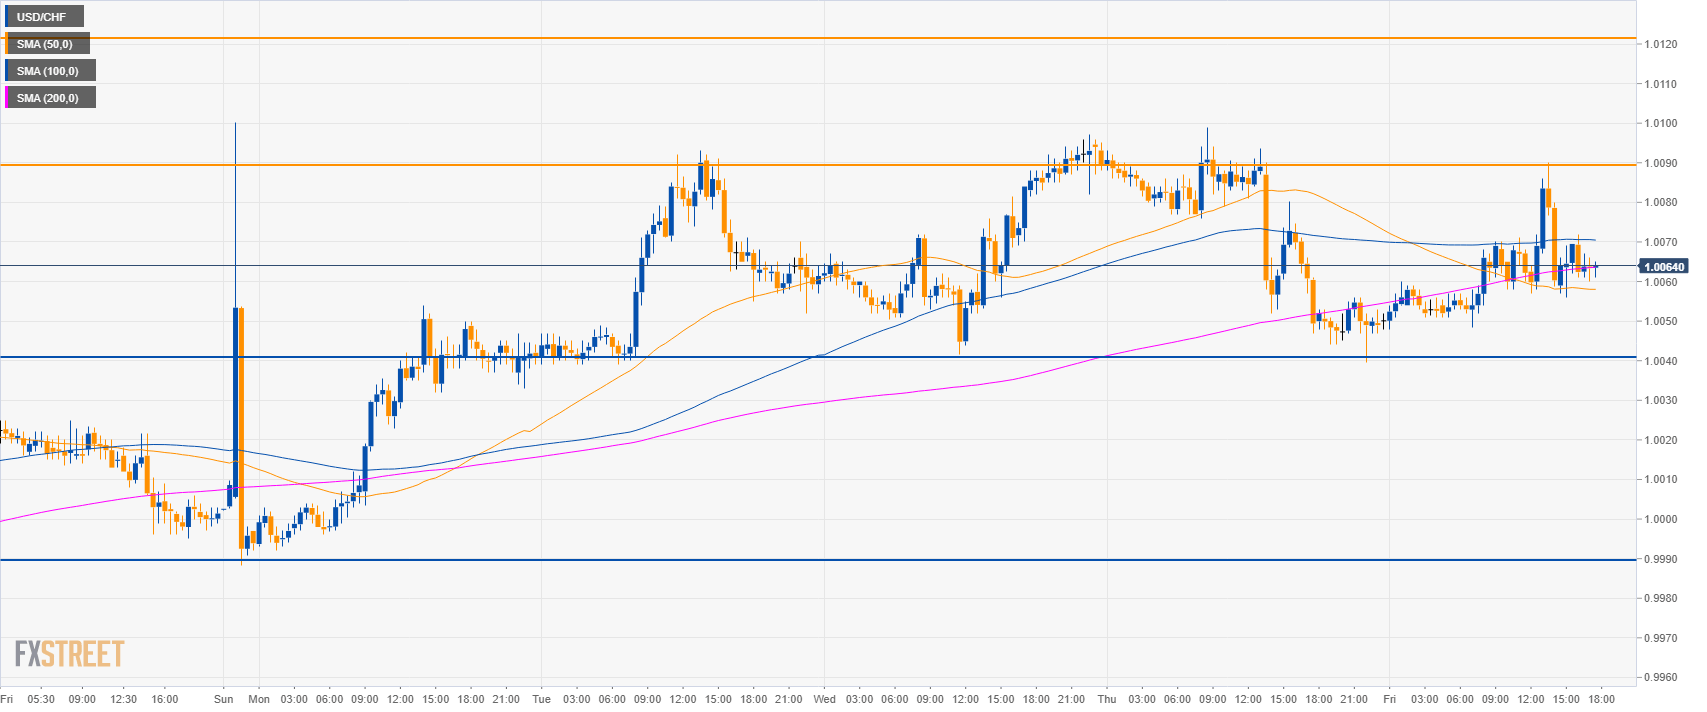
USD/CHF 30-minute chart
- USD/CHF is trading between the 100 and 200 SMA suggesting a sideways market, however, bears will most likely regain control in the coming sessions.
- To the downside, support is seen at 1.0040 and 0.9990 levels.
- Resistance is at 1.0090 and 1.0120.
Additional key levels
USD/CHF
Overview:
Today Last Price: 1.0063
Today Daily change: 10 pips
Today Daily change %: 0.10%
Today Daily Open: 1.0053
Trends:
Daily SMA20: 0.9986
Daily SMA50: 0.9924
Daily SMA100: 0.9947
Daily SMA200: 0.9909
Levels:
Previous Daily High: 1.0099
Previous Daily Low: 1.0044
Previous Weekly High: 1.003
Previous Weekly Low: 0.9943
Previous Monthly High: 0.9996
Previous Monthly Low: 0.9716
Daily Fibonacci 38.2%: 1.0065
Daily Fibonacci 61.8%: 1.0078
Daily Pivot Point S1: 1.0032
Daily Pivot Point S2: 1.001
Daily Pivot Point S3: 0.9977
Daily Pivot Point R1: 1.0087
Daily Pivot Point R2: 1.012
Daily Pivot Point R3: 1.0142
Author

Flavio Tosti
Independent Analyst


